
 LinkBack URL
 About LinkBacks
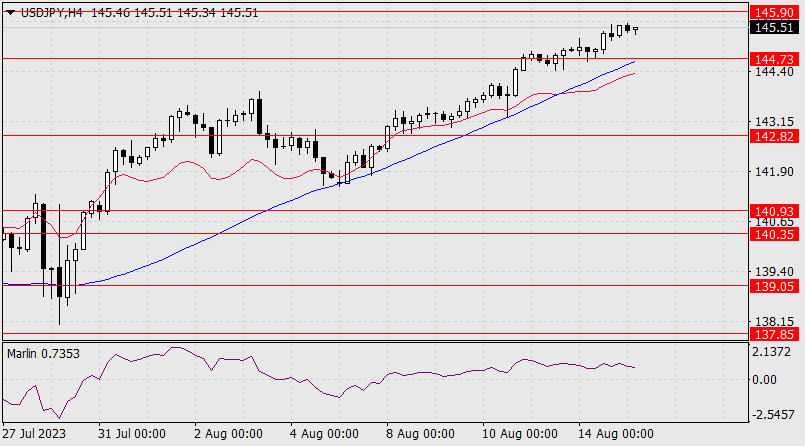
Forecast of USD/JPY on August 15, 2023
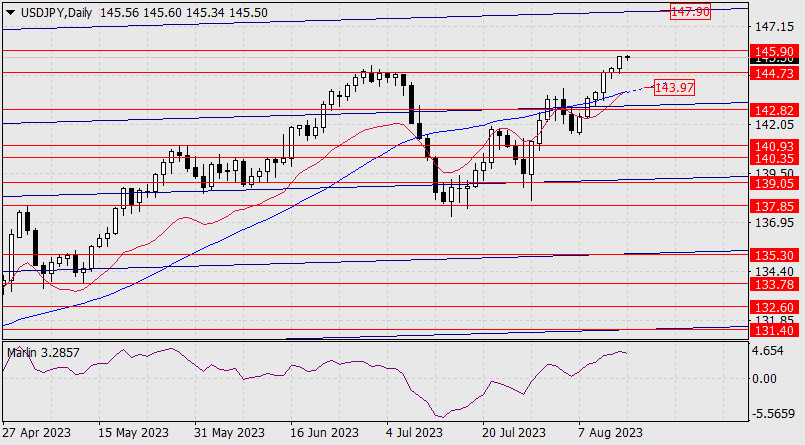
USD/JPY The USD/JPY pair is approaching the target level of 145.90. The Marlin oscillator is gradually turning downwards on the daily chart, indicating a correction towards the nearest support level at 144.73. If the pair surpasses this mark, the next corrective target would be the MACD line at 143.97.
If the price consolidates above 145.90, the pair might continue to rise to the nearest resistance of the global hyperchannel around the 147.90 mark. Beyond this level lies the 148.50 target. The bulls will probably aim for the 147.90-148.50 range next.
The shorter timeframe shows us that the MACD line is approaching the support line of 144.73. This fact certainly supports the uptrend, reducing the risk of a deep correction. However, the Marlin oscillator, being a leading indicator, is not growing but gradually decreasing. We expect traders to struggle at the 144.73 level.
Analysis are provided by InstaForex.
Read More
Please visit our sponsors
Results 3,921 to 3,930 of 4086
Thread: InstaForex Wave Analysis
-
15-08-2023, 05:16 AM #3921Senior Investor


- Join Date
- Jun 2012
- Posts
- 3,492
- Feedback Score
- 0
- Thanks
- 0
- Thanked 9 Times in 9 Posts

-
16-08-2023, 05:53 AM #3922Senior Investor
- Join Date
- Jun 2012
- Posts
- 3,492
- Feedback Score
- 0
- Thanks
- 0
- Thanked 9 Times in 9 Posts
Forecast for EUR/USD on August 16, 2023
EUR/USD Yesterday's performance was structurally similar to August 10th – a high upper shadow stopped by resistance. This time, the MACD line provided resistance.
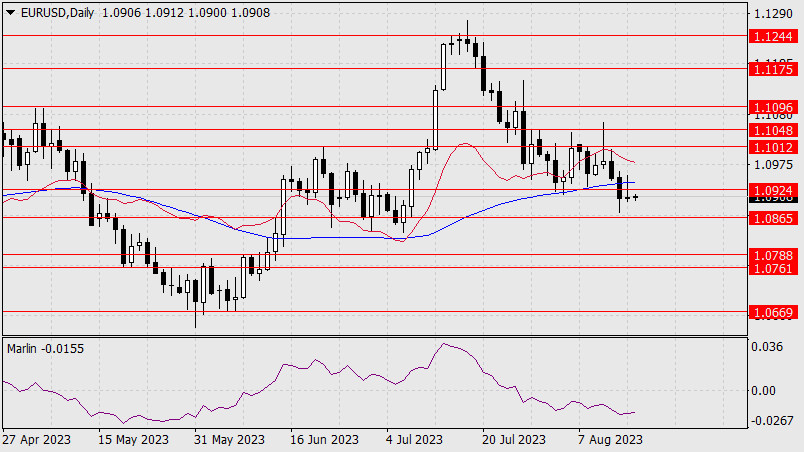
At the end of the day, the euro settled below this line and below the target level of 1.0924. Now the target is the support level of 1.0865. Consolidating below this level opens the target range of 1.0761/88. It looks like the stock market is already going into a medium- or long-term decline – we never got the expected corrective spike in quotes.
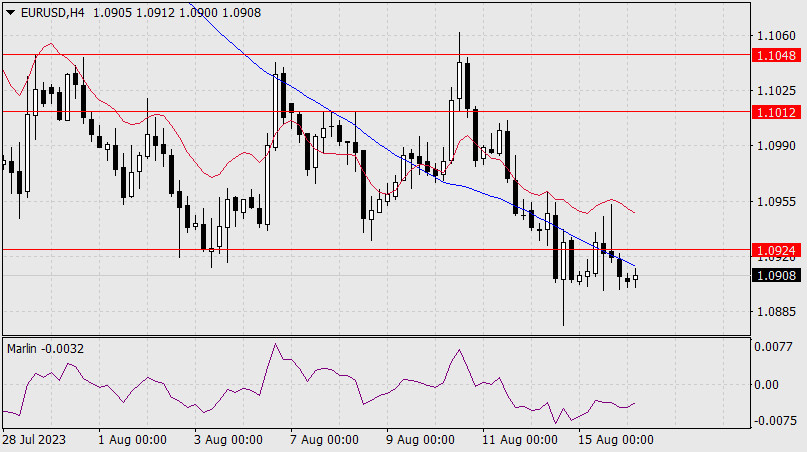
On the four-hour chart, the price also settled below the MACD line. The Marlin oscillator is descending in the downtrend territory.
Analysis are provided by InstaForex.
Read More
-
17-08-2023, 05:35 AM #3923Senior Investor
- Join Date
- Jun 2012
- Posts
- 3,492
- Feedback Score
- 0
- Thanks
- 0
- Thanked 9 Times in 9 Posts
GBP/USD, H4 | Bearish Continuation Expected?
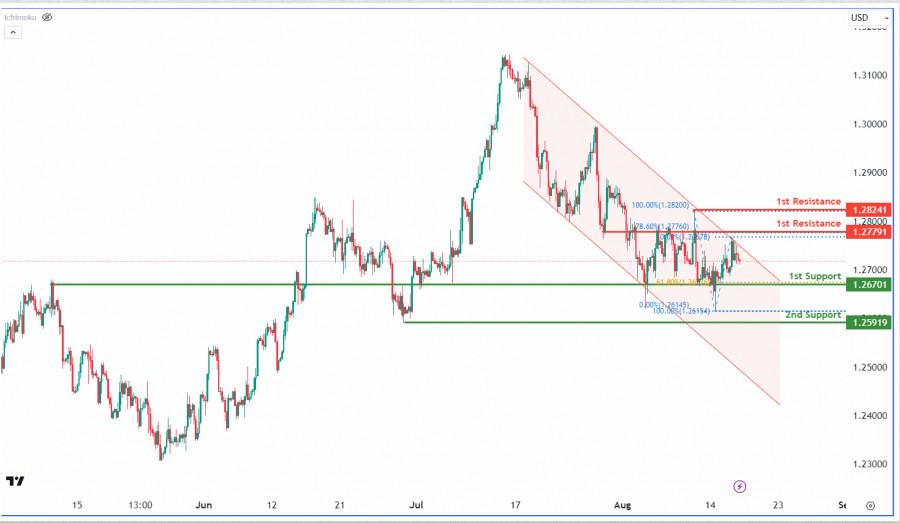
The GBP/USD chart exhibits a bearish trend within a descending channel. It suggests a potential move towards the 1st support at 1.2670, aligned with the 61.80% Fibonacci retracement. Additional support is at 1.2591, while resistances stand at 1.2779 and 1.2824, linked with Fibonacci retracement and swing levels respectively. The current chart patterns underscore the ongoing bearish momentum.
Analysis are provided by InstaForex.
Read More
-
18-08-2023, 12:21 PM #3924Senior Investor
- Join Date
- Jun 2012
- Posts
- 3,492
- Feedback Score
- 0
- Thanks
- 0
- Thanked 9 Times in 9 Posts
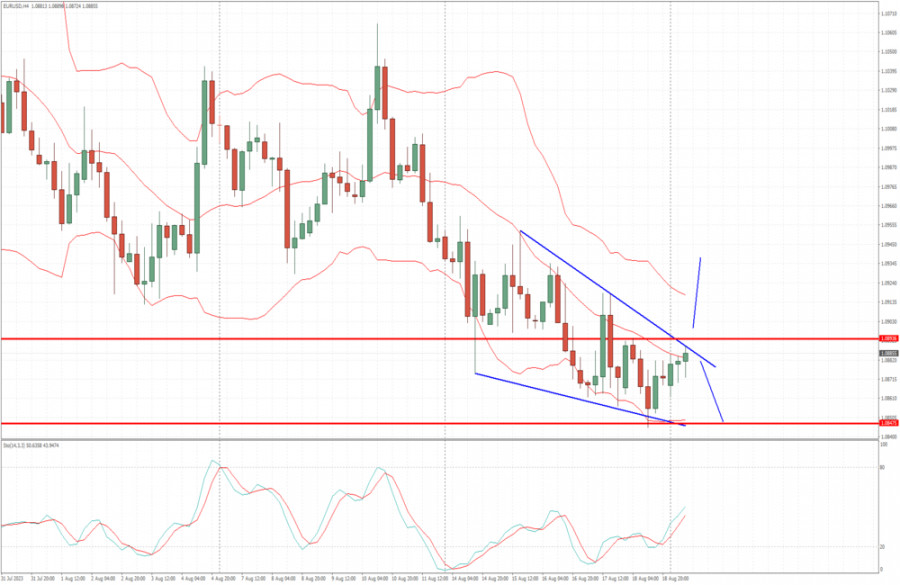
Indicator analysis: Daily review of EUR/USD on August 18, 2023
Trend analysis (Fig. 1).
The EUR/USD currency pair may move upward from the level of 1.0871 (closing of yesterday's daily candle) to 1.0917, the 14.6% pullback level (blue dotted line). In the case of testing this level, a continued upward movement is possible to the 1.0940 resistance level (thick red line).
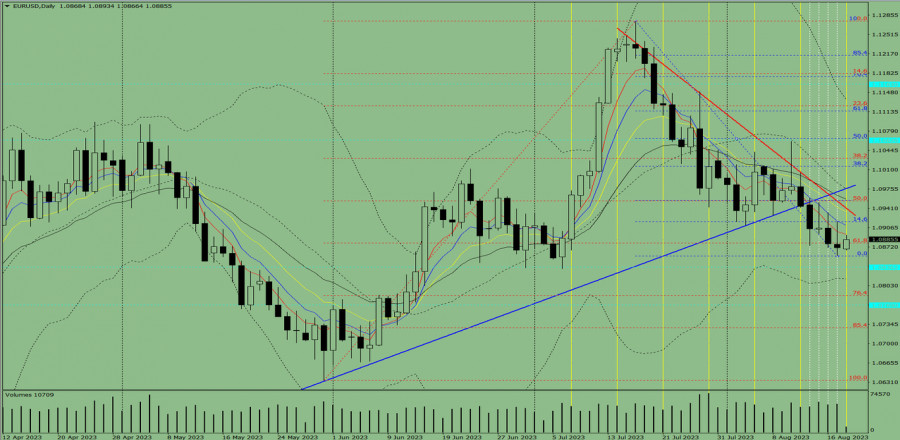
Fig. 1 (daily chart).
Comprehensive analysis:
Indicator analysis - up;
Fibonacci levels - up;
Candlestick analysis - up;
Trend analysis - up;
Bollinger bands - bottom;
Weekly chart - up.
General conclusion:
Today, the price may move upward from the level of 1.0871 (closing of yesterday's daily candle) to 1.0917, the 14.6% pullback level (blue dotted line). In the case of testing this level, a continued upward movement is possible to the 1.0940 resistance level (thick red line).
Alternatively, the price may move upward from the level of 1.0871 (closing of yesterday's daily candle) to 1.0917, the 14.6% pullback level (blue dotted line). In the case of testing this level, a downward movement is possible to the 61.8% pullback level (red dotted line).
Analysis are provided by InstaForex.
Read More
-
21-08-2023, 04:56 AM #3925Senior Investor

- Join Date
- Dec 2019
- Posts
- 2,109
- Feedback Score
- 0
- Thanks
- 0
- Thanked 0 Times in 0 Posts
The selection of a broker must be carefully considered, as a broker serves as the bridge for traders to engage in forex trading. That's why I chose to join Tickmill broker, so that I can conduct my trading comfortably and securely here.
-
21-08-2023, 03:02 PM #3926Senior Investor
- Join Date
- Jun 2012
- Posts
- 3,492
- Feedback Score
- 0
- Thanks
- 0
- Thanked 9 Times in 9 Posts
EUR/USD analysis for August 21, 2023 - Key resistance level on the test
Technical analysis:
EUR/USD has been trading upside this morning but I found that market is testing important pivot resistance at 1.0893.
In case of the rejection of the resistance at 1.0893, I see potential downside rotation towards $1.0850.
In case fo the breakout and hold above resistance at 1.0893, I see further rally towards 1.0920 and 1.0950
Stochastic oscillator is showing bullish divergence and bull reading.
Analysis are provided by InstaForex.
Read More
-
22-08-2023, 07:14 AM #3927Senior Investor
- Join Date
- Jun 2012
- Posts
- 3,492
- Feedback Score
- 0
- Thanks
- 0
- Thanked 9 Times in 9 Posts
Technical Analysis of Intraday Price Movement of Nasdaq 100 Index, Tuesday August 22, 2023
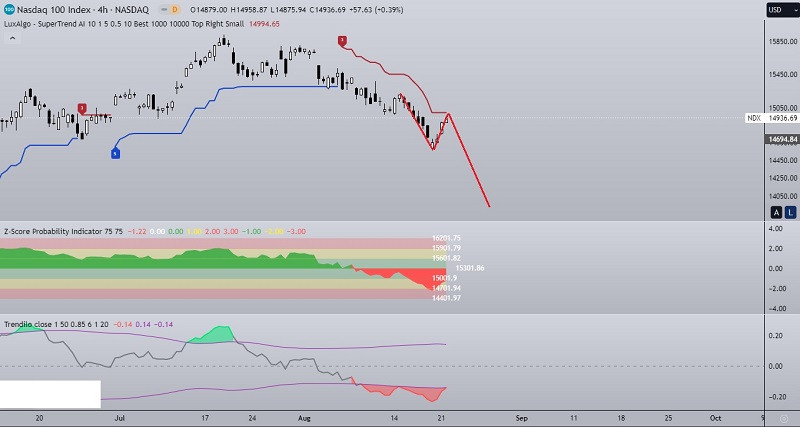
If we look at the 4-hour chart for the Nasdaq 100 index, even though the price is currently below the Supertrend AI indicator, but it has the potential to be corrected upwards, which can be seen from the Trendilo indicator which is trying to break above its Lower band so that 15301.86, and then #NDX still has a chance to continue its decline in the near future to the level of 14701.94 as the main target and 14401.97 as the next target to be achieved.
Analysis are provided by InstaForex.
Read More
-
23-08-2023, 05:40 AM #3928Senior Investor
- Join Date
- Jun 2012
- Posts
- 3,492
- Feedback Score
- 0
- Thanks
- 0
- Thanked 9 Times in 9 Posts
Trading plan for GBP/USD on August 23. Simple tips for beginners
Analyzing Tuesday's trades: GBP/USD on 30M chart
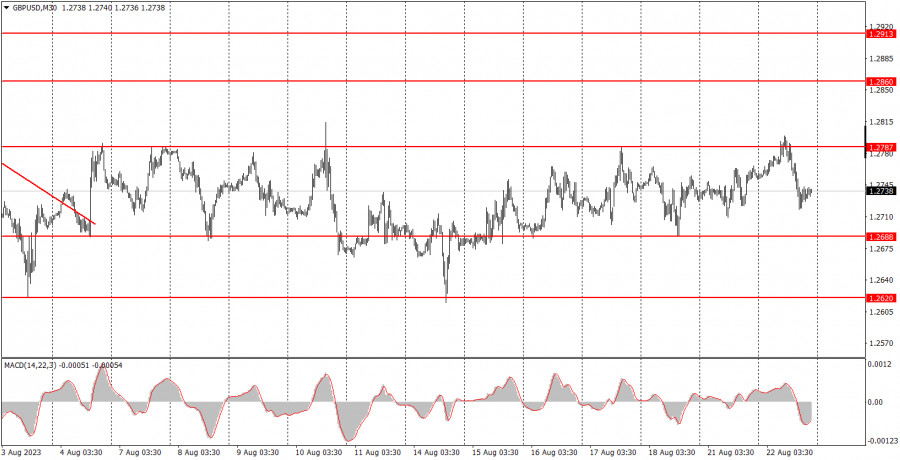
The GBP/USD pair showed quite an interesting downward movement on Tuesday. It retreated after testing the upper band of the sideways channel, in which it has been trading in for over three weeks. The chart above clearly shows what we mean. Thus, despite quite an interesting movement during the day (which was not provoked by a macroeconomic or fundamental background), the pair stayed within the sideways channel, meaning that the flat persists. We already mentioned this – no matter what movements we see, the pair is still moving sideways.
On Tuesday, there was nothing interesting about the economic calendar. One report in the US and a speech by a Federal Reserve official. Even if these events had a slim chance of affecting the market, they certainly aren't the reason for the dollar's growth. Since the upper band of the channel has been tested again, so now we can expect the pair to fall to the 1.2620 level.
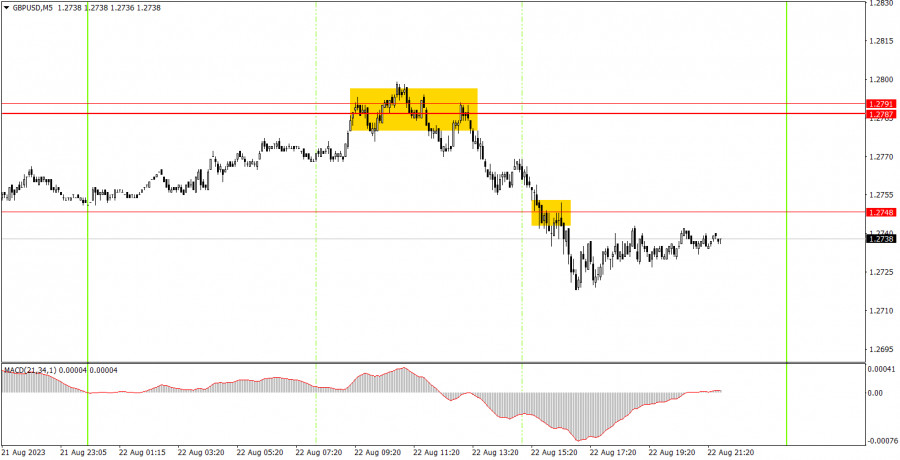
GBP/USD on 5M chart
Two trading signals were formed on the 5-minute chart. During the European session, the pair hovered around the 1.2787-1.2791 area for several hours, afterwards it finally rebounded from it, forming a sell signal. Subsequently, the price successfully breached the 1.2748 level at its first attempt and there were no more signals for the rest of the day. Therefore, the short position should have been closed manually towards the evening, with a profit of no less than 40 pips, which is quite good given that volatility was 80 points.
Trading tips on Wednesday:
On the 30-minute chart, the GBP/USD pair continues to move in a sideways channel. We still expect the pound to fall, as we still believe it is overbought and unreasonably expensive. However, the market has taken a break for now, so either trade within the sideways channel or wait for the flat to end. In the coming days, we can expect the pound to fall by about 100 pips. The key levels on the 5M chart are 1.2499, 1.2538, 1.2605-1.2620, 1.2653, 1.2688, 1.2748, 1.2787-1.2791, 1.2848-1.2860, and 1.2913. Once the price moves 20 pips in the right direction after opening a trade, you can set the stop-loss at breakeven. On Wednesday, PMIs in the services and manufacturing sectors will be published in both the UK and the US. These aren't crucial reports, and they are unlikely to move the pair out of the flat.
Basic trading rules:
1) The strength of the signal depends on the time period during which the signal was formed (a rebound or a break). The shorter this period, the stronger the signal.
2) If two or more trades were opened at some level following false signals, i.e. those signals that did not lead the price to Take Profit level or the nearest target levels, then any consequent signals near this level should be ignored.
3) During the flat trend, any currency pair may form a lot of false signals or do not produce any signals at all. In any case, the flat trend is not the best condition for trading.
4) Trades are opened in the time period between the beginning of the European session and until the middle of the American one when all deals should be closed manually.
5) We can pay attention to the MACD signals in the 30M time frame only if there is good volatility and a definite trend confirmed by a trend line or a trend channel.
6) If two key levels are too close to each other (about 5-15 pips), then this is a support or resistance area.
How to read charts:
Support and Resistance price levels can serve as targets when buying or selling. You can place Take Profit levels near them.
Red lines are channels or trend lines that display the current trend and show which direction is better to trade.
MACD indicator (14,22,3) is a histogram and a signal line showing when it is better to enter the market when they cross. This indicator is better to be used in combination with trend channels or trend lines.
Important speeches and reports that are always reflected in the economic calendars can greatly influence the movement of a currency pair. Therefore, during such events, it is recommended to trade as carefully as possible or exit the market in order to avoid a sharp price reversal against the previous movement.
Beginners should remember that every trade cannot be profitable. The development of a reliable strategy and money management are the key to success in trading over a long period of time.
Analysis are provided by InstaForex.
Read More
-
24-08-2023, 06:29 AM #3929Senior Investor
- Join Date
- Jun 2012
- Posts
- 3,492
- Feedback Score
- 0
- Thanks
- 0
- Thanked 9 Times in 9 Posts
Forecast for EUR/USD on August 24, 2023
EUR/USD
Yesterday, the euro broke through the key support level at 1.0834. By the end of the day, the euro had risen by 17 points. The nature of this movement suggests that this breakthrough was false. This morning, the price continues to rise above the 1.0865 level. The Marlin oscillator continues its upward turn. Market participants are concerned that tomorrow, Federal Reserve Chairman Jerome Powell will confirm the idea of a strong American economy and hint at another rate hike(possibly by 0.50%).
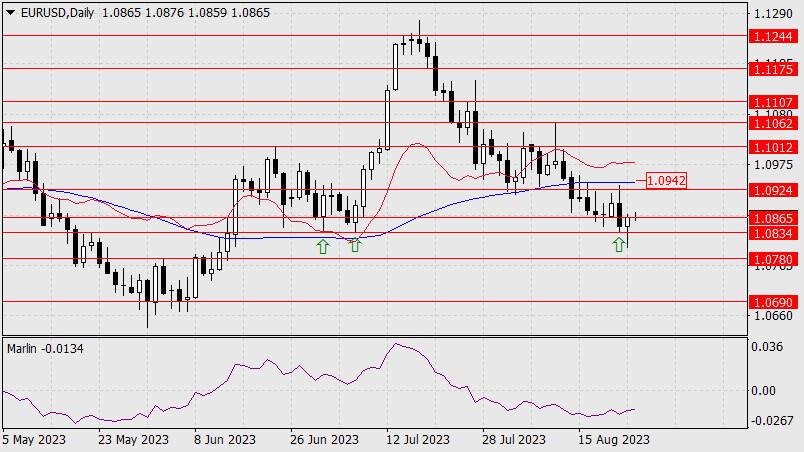
The concern arises from the fact that seemingly obvious things might be interpreted differently by the Fed itself, implying that there might be no further tightening. Generally, the Jackson Hole conference doesn't discuss specific issues, such as a rate hike in a month or two, so there will be opportunities for speculation in interpreting Powell's words. Considering the increased volatility of the EUR/USD pair, it might reach the target range of 1.0924/42 regardless of the tone set by the Fed chair. The question is about the euro's medium-term perspective.
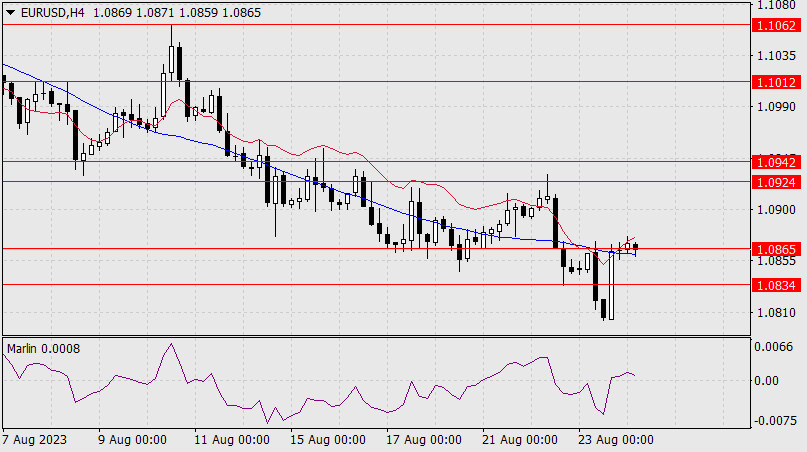
On the four-hour chart, following the false downward movement, the price returned above the MACD line, and the Marlin oscillator entered the positive territory. An uptrend in the short-term, and the target range of 1.0924/42 is in sight. Consolidating above this range will open up the next target at 1.1012.
Analysis are provided by InstaForex.
Read More
-
25-08-2023, 05:44 AM #3930Senior Investor
- Join Date
- Jun 2012
- Posts
- 3,492
- Feedback Score
- 0
- Thanks
- 0
- Thanked 9 Times in 9 Posts
EURUSD, H4 | Bounce off support level?
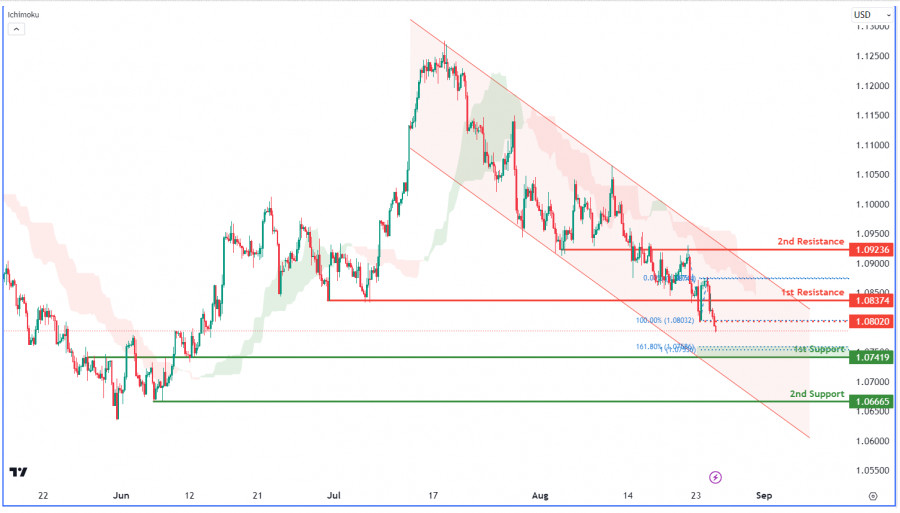
The EUR/USD pair is showing bearish tendencies, emphasized by its movement in a descending channel and its position beneath a bearish Ichimoku cloud, hinting at a possible price reversal. Given these signals, the pair may continue its descent towards the 1st support at 1.0741. This support gains significance from being an overlap support and its alignment with the 161.80% Fibonacci Extension and 100% level. The 2nd support lies at 1.0666, known as a swing low support. If there's an upward shift, the 1st resistance is at 1.0837, marked as an overlap resistance. The 2nd resistance is at 1.0923, another overlap point. In between, an intermediate resistance exists at 1.0802, serving as a pullback resistance.
Analysis are provided by InstaForex.
Read More
-
Sponsored Links


 Reply With Quote
Thread Information
Users Browsing this Thread
There are currently 1 users browsing this thread. (0 members and 1 guests)
 Posting Permissions
24 Hour Gold

Advertising
- Over 20.000 UNIQUE Daily!
- Get Maximum Exposure For Your Site!
- Get QUALITY Converting Traffic!
- Advertise Here Today!
Out Of Billions Of Website's Online.
Members Are Online From.
- Get Maximum Exposure For Your Site!
- Get QUALITY Converting Traffic!
- Advertise Here Today!
Out Of Billions Of Website's Online.
Members Are Online From.


