
 LinkBack URL
 About LinkBacks
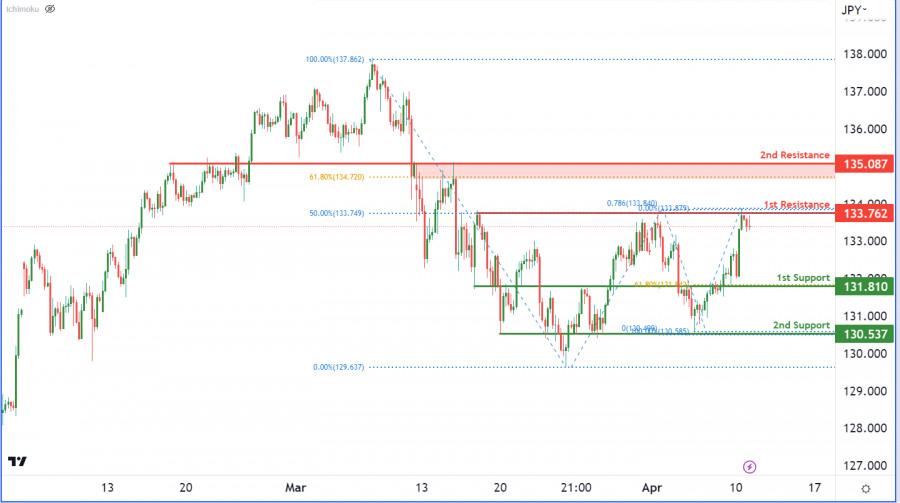
USDJPY, H4 | Potential reversal from 1st resistance?
The current momentum of the USD/JPY chart is bearish, indicating a potential price drop in the near future. A significant resistance level to watch is at 133.76, which is a strong pullback resistance level and coincides with the 78.60% Fibonacci projection. If the price reacts bearishly at this level, it may potentially fall towards the first support at 131.81. This support level is an overlap support and also lines up with the 61.80% Fibonacci retracement level, making it a significant level for a potential price rebound.
If the price breaks below the first support, it may fall towards the second support at 130.53, which is also an overlap support level. However, if the price breaks above the first resistance, it may potentially rise towards the second resistance at 134.08. This is an overlap resistance level and also has the 61.80% Fibonacci retracement level lining up with it, making it a significant level to watch.
Analysis are provided by InstaForex.
Read More
Please visit our sponsors
Results 3,821 to 3,830 of 4086
Thread: InstaForex Wave Analysis
-
11-04-2023, 07:32 AM #3821Senior Investor


- Join Date
- Jun 2012
- Posts
- 3,492
- Feedback Score
- 0
- Thanks
- 0
- Thanked 9 Times in 9 Posts

-
12-04-2023, 04:56 AM #3822Senior Investor
- Join Date
- Jun 2012
- Posts
- 3,492
- Feedback Score
- 0
- Thanks
- 0
- Thanked 9 Times in 9 Posts
Technical Analysis of Intraday Price Movement of Nasdaq 100 Index, Wednesday April 12, 2023
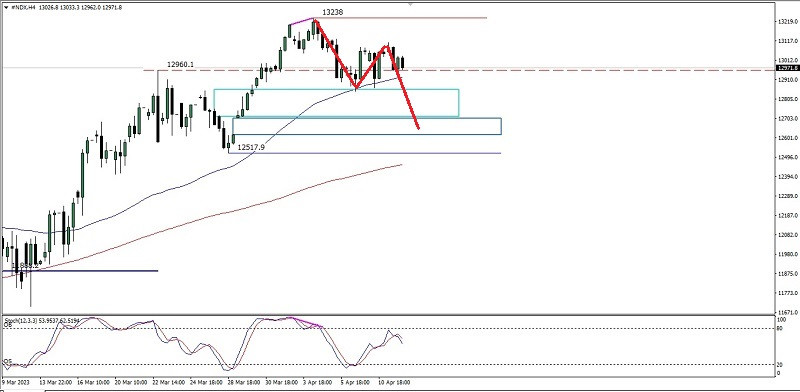
With the appearance of deviation between Nasdaq 100 index price movement with Stochastic Oscillator indicator on the 4 hour chart then it is high likely for #NDX will depreciated for some time in the future up to the area level of 12705,8-12617,7 however during the decline not exceed below the level of 12517,9 then #NDX still has the potential to back to rallying upwards up to the level of 13238,0.
Analysis are provided by InstaForex.
Read More
-
13-04-2023, 06:21 AM #3823Senior Investor
- Join Date
- Jun 2012
- Posts
- 3,492
- Feedback Score
- 0
- Thanks
- 0
- Thanked 9 Times in 9 Posts
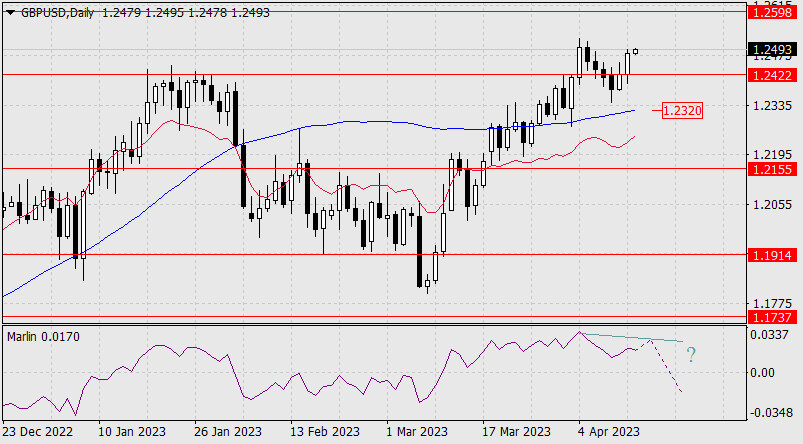
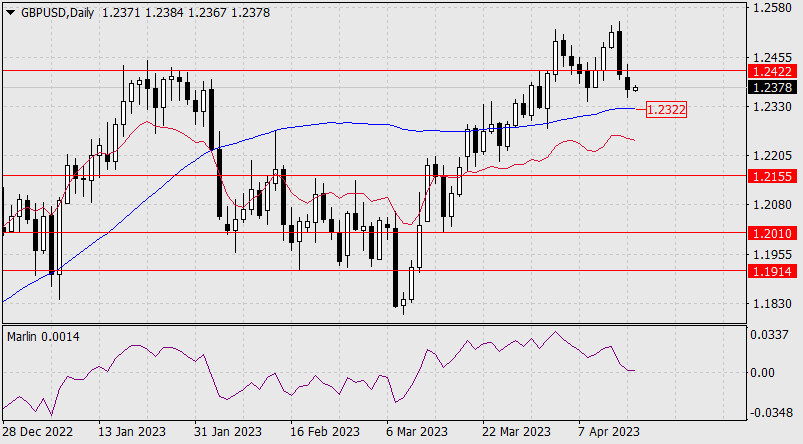
Forecast for GBP/USD on April 13, 2023
As a result of yesterday, the pound rose by 60 points, trying to move faster and further away from the 1.2422 level. The nearest target will be 1.2598 – the peak of June 7, 2022. At the same time, there is a high probability of forming a reversal divergence with the Marlin oscillator.
On the four-hour chart, the price is climbing above the balance and MACD indicator lines, and the Marlin oscillator is growing in the "green zone". We have an uptrend.
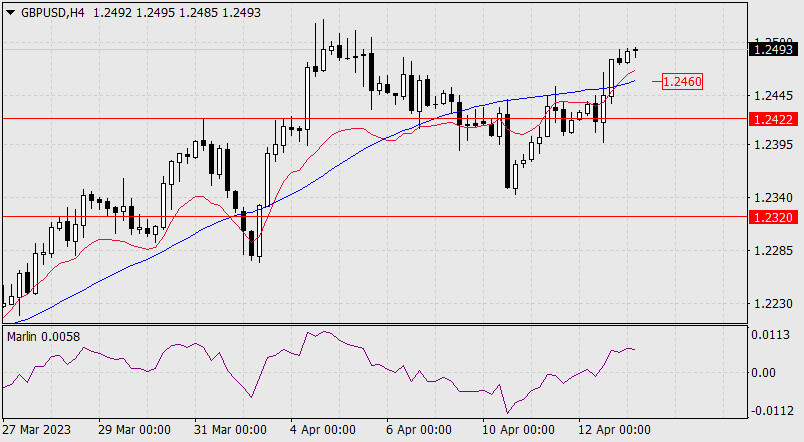
The primary signal of a reversal is when the price falls below the MACD indicator line (1.2460), and the signal will be confirmed once the price settles below the 1.2422 level. The pound's final decision to take a course for a medium-term decline is when it moves below the MACD line, in the area of the 1.2320 mark.
Analysis are provided by InstaForex.
Read More
-
14-04-2023, 05:23 AM #3824Senior Investor
- Join Date
- Jun 2012
- Posts
- 3,492
- Feedback Score
- 0
- Thanks
- 0
- Thanked 9 Times in 9 Posts
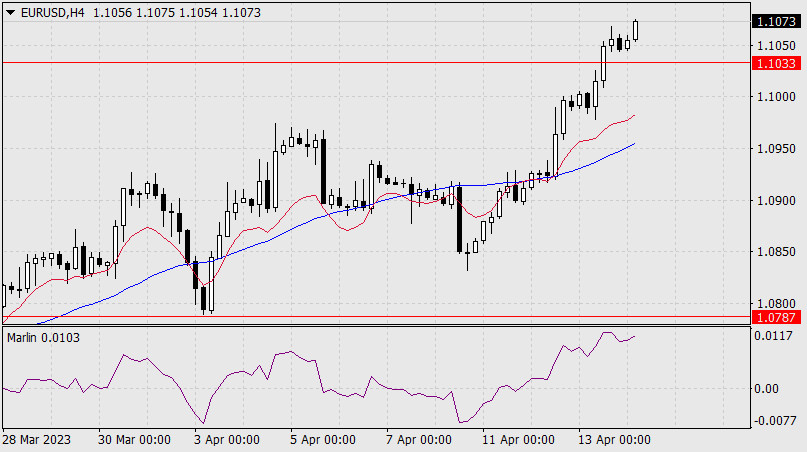
Forecast for EUR/USD on April 14, 2023
Yesterday's rise in the dollar index by 0.57% and the euro's rise by 0.49% were largely based on expectations for today's quarterly reports from the biggest US banks. As expected, JPMorgan Chase, Wells Fargo, Citigroup, and PNC Financial Services will show good profits, which is important for demonstrating the resilience of the banking sector. Meanwhile, there may be some difficulties with the world's largest asset management company, BlackRock, which is also set to report today, since its in a haste to get rid of bad Credit Suisse assets.
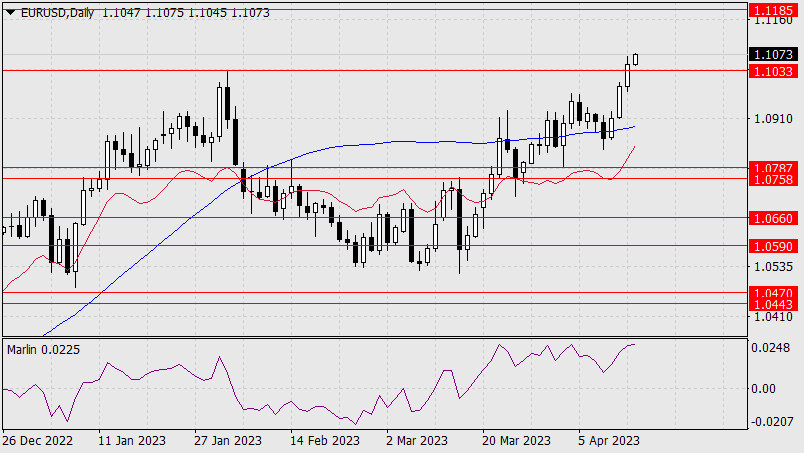
Overall, investors have an appetite for risk, and the euro may reach the target level of 1.1185 – which is the peak of March 31, 2022, and the low of November 24, 2021. Yesterday, the price overcame the first resistance at 1.1033, and the Marlin oscillator slightly turned downward. EUR may take a quick break and consolidate at this level as it braces to rise further.
On the four-hour chart, the price is vigorously growing above the rising indicator lines, the Marlin oscillator has slowed down and is ready to edge down, discharging before further growth.
Analysis are provided by InstaForex.
Read More
-
17-04-2023, 06:53 AM #3825Senior Investor
- Join Date
- Jun 2012
- Posts
- 3,492
- Feedback Score
- 0
- Thanks
- 0
- Thanked 9 Times in 9 Posts
EURUSD, Day | Continue to 1st Support?
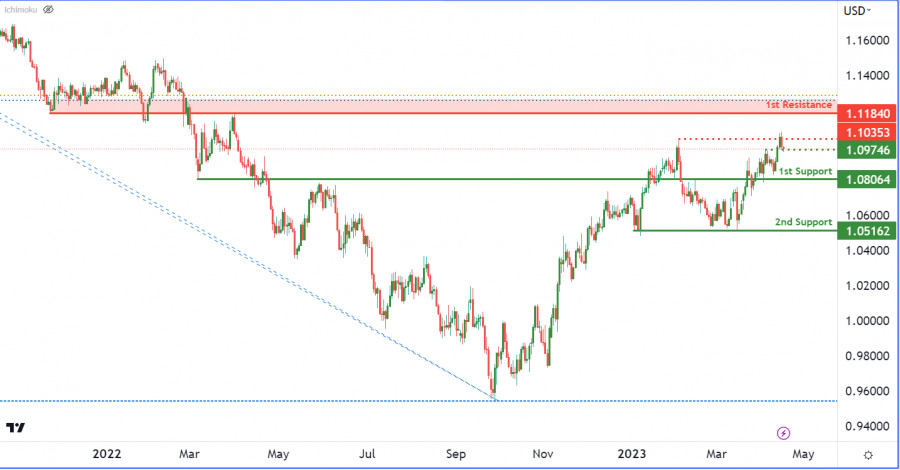
The EUR/USD chart currently displays an overall bearish momentum, indicating a potential continuation of bearish movements towards the 1st support level. The 1st support level at 1.0806 is an overlap support that has previously demonstrated its strength. However, should the price break through this level, it could potentially drop further towards the 2nd support at 1.0516, which is a multi-swing low support.
Resistance levels for the EUR/USD can be found at 1.1184 and 1.1035. The 1st resistance level is an overlap resistance that is crucial in monitoring for any potential bearish movements. Meanwhile, the intermediate resistance at 1.1035 is a multi-swing high resistance that could potentially trigger a stronger bearish trend towards the 1st support level if the price breaks through it. It's important to note that there is also an intermediate support level at 1.0974, which is a pullback support. Should the price bounce from this level, it could potentially rise towards the intermediate resistance at 1.1035
Analysis are provided by InstaForex.
Read More
-
18-04-2023, 06:19 AM #3826Senior Investor
- Join Date
- Jun 2012
- Posts
- 3,492
- Feedback Score
- 0
- Thanks
- 0
- Thanked 9 Times in 9 Posts
Forecast for GBP/USD on April 18, 2023
Yesterday, the British pound showed strong volatility, closing the day with a loss of 38 points. On the daily chart, the signal line of the Marlin oscillator has approached the limit of the downtrend, so to break through it, the price should settle below the MACD indicator line (1.2322). Consolidating below support will open the next target at 1.2155 - the peak of November 2022.
On the four-hour chart, we can see that yesterday's trading range was formed below the target level of 1.2422. The balance indicator line in red also helped the level.
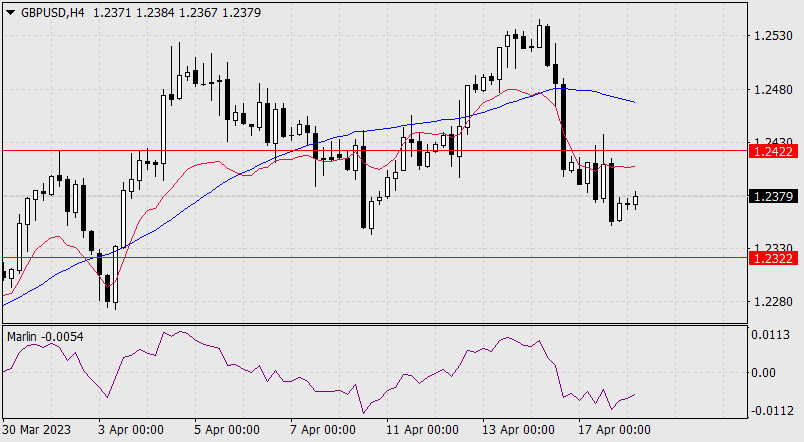
This is a sign of strong resistance, so in the near future, I expect the price to cross the support level of 1.2322. The Marlin oscillator is also set to fall further.
Analysis are provided by InstaForex.
Read More
-
19-04-2023, 06:30 AM #3827Senior Investor
- Join Date
- Jun 2012
- Posts
- 3,492
- Feedback Score
- 0
- Thanks
- 0
- Thanked 9 Times in 9 Posts
Forecast for USD/JPY on April 19, 2023
Yesterday, the US dollar lost 35 points against the Japanese yen, coinciding with the dollar weakening throughout the market and the price's struggle with the technical resistance of the strong price channel line (134.30, daily).
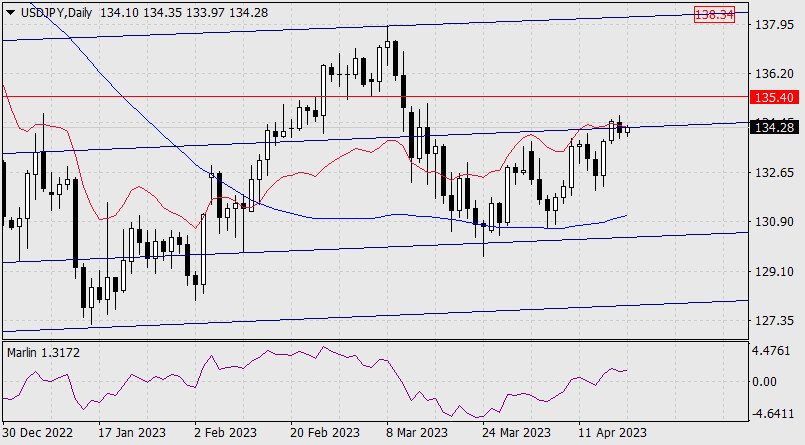
The signal line of the Marlin oscillator is pointing upward in the area of the uptrend. The bullish target is 135.40 - the low on March 6th. Consolidating above this level will allow the price to rise to the next embedded price channel line around 138.34.
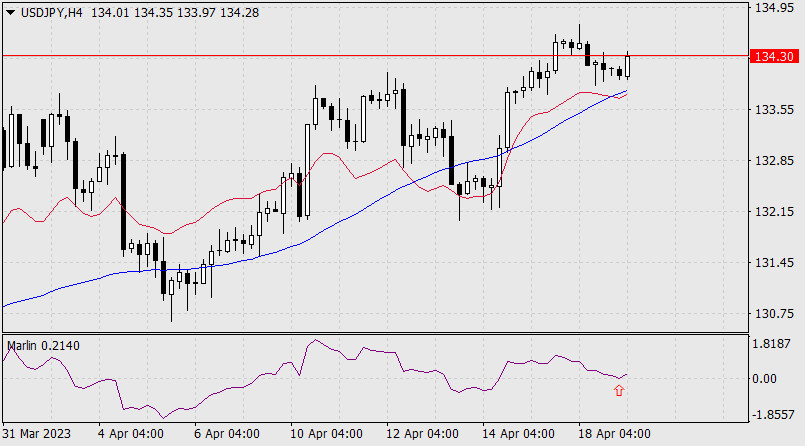
On the four-hour chart, the Marlin oscillator resumed growth after the signal line rebounded from the limit of the area of the downtrend (arrow). The price is rising above the balance and MACD lines, with the main trend being upward. To guarantee it, the price needs to consolidate above 134.30.
Analysis are provided by InstaForex.
Read More
-
20-04-2023, 05:07 AM #3828Senior Investor
- Join Date
- Jun 2012
- Posts
- 3,492
- Feedback Score
- 0
- Thanks
- 0
- Thanked 9 Times in 9 Posts
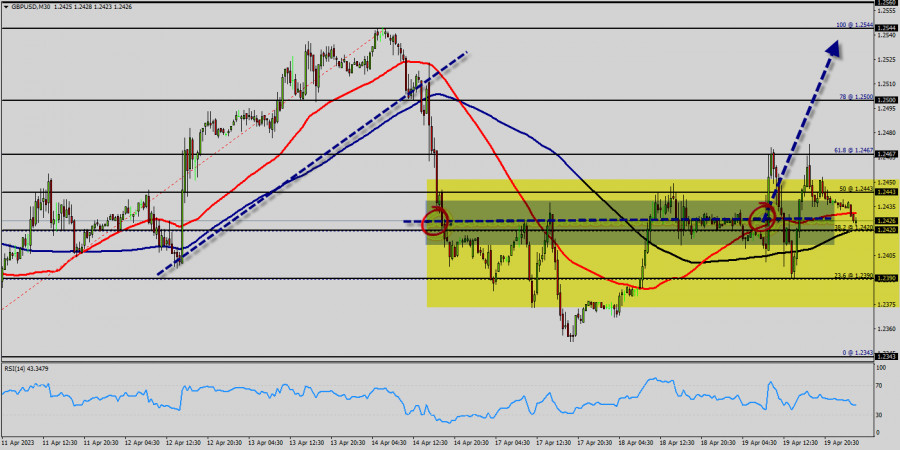
Technical analysis of GBP/USD for April 19, 2023
Overview :
The GBP/USD pair continues to move upwards from the level of 1.2390. According to the previous events, the GBP/USD pair is still moving between the levels of 1.2390 and 1.2427; for that we expect a range of 110 pips (1.2500 - 1.2390). On the one-hour chart, immediate support level is seen at 1.2390, which coincides with a ratio of 23.6% Fibonacci retracement.
Currently, the price is moving in a bullish channel. This is confirmed by the RSI indicator signaling that we are still in a bullish trending market. The price is still above the moving average (100) and (50). Therefore, if the trend is able to break out through the first resistance level of 1.2443, we would see the pair climbing towards the daily resistance at 1.2500 to test it. It would also be wise to consider where to place stop loss; this should be set below the second support of 1.2343.
It should always be noted that: If the trend is upward, the strength of the currency will be defined as follows: GBPis in an uptrend and USD is in a downtrend. The stop loss should never exceed your maximum exposure amounts. The market is highly volatile if the last day had huge volatility. Signal :
According to the previous events, the price of the GBP/USD pair has been still trading between the levels of 1.2343 and 1.2500. The level of 1.2544 is representing the double top and the weekly support one has set at the same price. Buy above the spot of 1.2420 with the targets 1.2427 and 1.2544. On the other hand, the daily strong support is seen at 1.2390. If the GB/USD pair is able to break out the level of 1.2390, the market will decline further to 1.2303.
Analysis are provided by InstaForex.
Read More
-
20-04-2023, 05:12 AM #3829Senior Investor
- Join Date
- Jun 2012
- Posts
- 3,492
- Feedback Score
- 0
- Thanks
- 0
- Thanked 9 Times in 9 Posts
EUR/USD. Trapped in a wide-ranging flat: traders are stuck within the range of the 9th figure
The euro-dollar pair is trading in a broad price range, but at the same time, it is effectively stagnating, reflecting the indecisiveness of both buyers and sellers. Despite the fairly strong volatility, traders are unable to leave the area of the 9-figure range to develop either an upward or downward movement. This price dynamic is due to the contradictory fundamental background that has emerged for the EUR/USD pair.
Initiative changes hands
Overall, the pair this week mirrors the trajectory of the US dollar index: on Monday, the greenback strengthened its positions across the market, causing the EUR/USD price to "visit" the 8-figure area. On Tuesday, the dollar was under pressure, which the pair's buyers took advantage of. Dollar bulls are again dictating their rules of the game, pulling the pair towards the base of the 9th price level. These "roller coaster" fluctuations are primarily related to the strengthening/weakening of risk-off sentiments in the markets. In addition, traders are quite sensitive to the strengthening/weakening of hawkish expectations regarding the further actions of the Fed/ECB. All other fundamental factors play a more supporting role.
I would like to remind you that initially, the greenback's position was strengthened by Fed representative Christopher Waller, who during his Friday speech, allowed for several interest rate hikes this year. Considering the fact that the market had "come to terms" with one final increase in May, this remark triggered strong volatility among dollar pairs. The hawkish signal came against the backdrop of a decline in overall inflation in the US, a slowdown in the producer price index and the core PCE index. The only concern is the core consumer price index, which accelerated to 5.6% in March (previously, the indicator had been declining consecutively for three months).
The Fed's median forecast, updated at the March meeting, assumes one more rate hike by the end of this year. The probability of a 25 basis point increase following the May meeting is now at 89%. However, the market is doubtful that the Federal Reserve will take further steps in this direction. Most Fed representatives are in favor of tightening monetary policy but only in the context of the May increase. Further decisions will depend on incoming data, primarily in the area of inflation.
For example, Federal Reserve Bank President Raphael Bostic recently stated that his baseline forecast assumes that rates will remain unchanged after the next (May) increase. The head of the St. Louis Fed, who is a consistent "hawk," allowed for a rate increase to 5.75%. However, he called for avoiding broad forward guidance at the May meeting. Federal Reserve Bank of San Francisco President Mary Daly voiced a rather vague formulation, the essence of which is that subsequent decisions will depend on the dynamics of inflation. According to her, the tightening of monetary policy is now at the stage where "the central bank does not expect further rate hikes at every meeting." Richmond Fed President Thomas Barkin expressed confidence that inflation had already peaked, but he wants to see more evidence that it is returning to the target level. Several other Fed representatives also spoke in the same vein. Notably, New York Fed President John Williams even allowed for a rate cut at the end of the year, "if inflation slows down sufficiently."
As we can see, at the moment, we can only speak with some certainty about the May rate hike (as eloquently evidenced by the CME FedWatch Tool). The further prospects for tightening monetary policy look uncertain, considering the side effects of measures already taken and the decline in key inflation indicators.
Taking into account such uncertainty, EUR/USD traders should be very cautious about hawkish statements from Federal Reserve representatives, as the influence of their messages is short-term in nature. Moreover, the European Central Bank also demonstrates a hawkish stance, discussing whether to raise rates in May by 25 or 50 basis points.
Don't trust price fluctuations
It's worth noting that the US dollar index reacts not only to the statements of Fed members. The agenda is also determined by the overall market sentiment, which reflects the degree of interest in risk assets or defensive instruments. These are quite shaky, unreliable, and highly variable fundamental arguments.
For example, yesterday the dollar was under pressure due to the release of strong GDP growth data from China. Macroeconomic reports, which were almost all in the "green," confirmed the recovery of the Chinese economy after the lifting of quarantine restrictions and the abandonment of the zero-tolerance policy towards COVID-19. This fact returned optimism to the market and contributed to the overall improvement of market sentiment. The safe-haven greenback was, as they say, "out of the picture" – the dollar index lost its gained positions.
But now the US currency has regained strength, as traders' risk appetite began to weaken amid caution due to the quarterly earnings season in the US economy. In addition, the dollar is strengthening against the backdrop of rising Treasury yields (in particular, the yield on 10-year bonds was around 3.63% - the highest level since March 22).
As a rule, such fundamental factors "flare up brightly but quickly fade." During one trading day, interest in risk can increase or decrease, providing support or pressure on the EUR/USD pair. Conclusions
The euro-dollar pair demonstrates increased volatility, but traders cannot determine the direction of the price movement. Therefore, any trading decisions (both towards the south and the north) are inherently risky, as the pair traces a wave-like trajectory.
In my opinion, the pair has not exhausted its growth potential, so long positions remain a priority: the dollar temporarily strengthens its positions on shaky foundations and cannot break the northern trend. However, considering long positions is advisable only after EUR/USD buyers consolidate above the 1.1000 mark (Kijun-sen line on the four-hour chart). The next (main) target of the northern movement in this case will be the 1.1100 mark – this is the upper line of the Bollinger Bands indicator on the daily chart.
Analysis are provided by InstaForex.
Read More
-
21-04-2023, 06:51 AM #3830Senior Investor
- Join Date
- Jun 2012
- Posts
- 3,492
- Feedback Score
- 0
- Thanks
- 0
- Thanked 9 Times in 9 Posts
USDJPY, H4 | Bounce off 1st support?
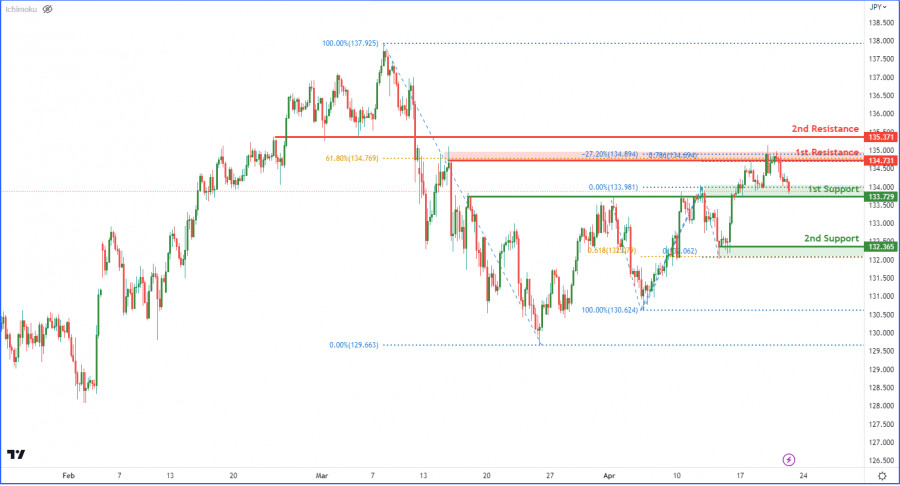
The USD/JPY chart currently exhibits strong bullish momentum, with potential for prices to bounce off the 1st support level at 133.72 and advance towards the 1st resistance level at 134.73.
The 1st support level, coinciding with current price, is an overlap support that signals a robust buying interest. Additionally, the 2nd support level, aligned with the 61.80% Fibonacci projection, reinforces its importance as a significant support level.
As for resistance levels, the 1st resistance level is a multi-swing high resistance that corresponds with the 61.80% Fibonacci retracement, and is expected to present a significant challenge for upward price movements. Similarly, the 2nd resistance level, a pullback resistance, may also impede bullish momentum.
Analysis are provided by InstaForex.
Read More
-
Sponsored Links


 Reply With Quote
Thread Information
Users Browsing this Thread
There are currently 2 users browsing this thread. (0 members and 2 guests)
 Posting Permissions
24 Hour Gold

Advertising
- Over 20.000 UNIQUE Daily!
- Get Maximum Exposure For Your Site!
- Get QUALITY Converting Traffic!
- Advertise Here Today!
Out Of Billions Of Website's Online.
Members Are Online From.
- Get Maximum Exposure For Your Site!
- Get QUALITY Converting Traffic!
- Advertise Here Today!
Out Of Billions Of Website's Online.
Members Are Online From.


