
 LinkBack URL
 About LinkBacks
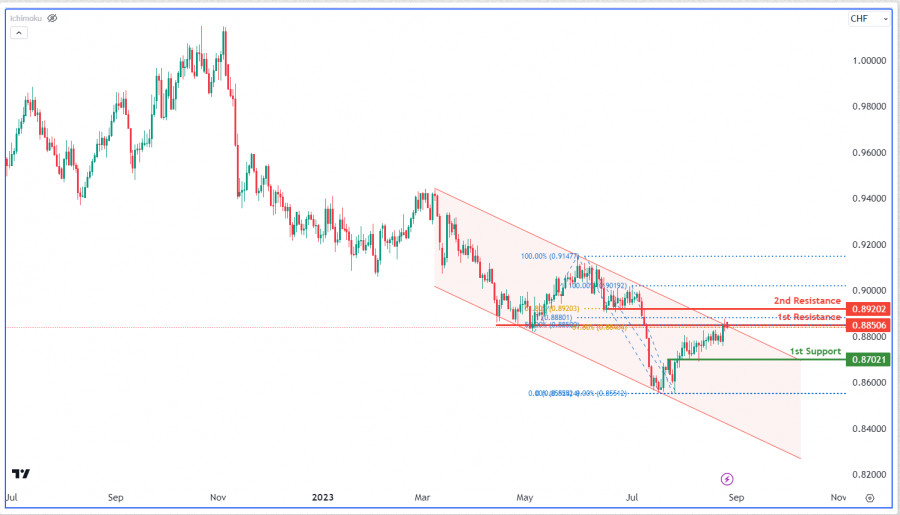
USDCHF, Day | React off resistance level?
The USD/CHF chart displays a bearish trend within a descending channel, indicating a continued price decline. There's a potential for the price to react bearishly at the 1st resistance of 0.8850, influenced by its overlap resistance classification and Fibonacci confluence with the 50% and 61.80% retracement levels, before moving towards the overlap-supported level at 0.8702. The 2nd resistance at 0.8920, also an overlap resistance, strengthens its significance by aligning with the 61.80% Fibonacci Retracement.
Analysis are provided by InstaForex.
Read More
Please visit our sponsors
Results 3,931 to 3,940 of 4086
Thread: InstaForex Wave Analysis
-
28-08-2023, 05:05 AM #3931Senior Investor


- Join Date
- Jun 2012
- Posts
- 3,492
- Feedback Score
- 0
- Thanks
- 0
- Thanked 9 Times in 9 Posts

-
29-08-2023, 04:50 AM #3932Senior Investor
- Join Date
- Jun 2012
- Posts
- 3,492
- Feedback Score
- 0
- Thanks
- 0
- Thanked 9 Times in 9 Posts
JAPAN JOBLESS RATE RISES TO 2.7% IN JULY

The unemployment rate in Japan came in at a seasonally adjusted 2.7 percent in July, the Ministry of Internal Affairs and Communications said on Tuesday.
That exceeded expectations for 2.5 percent, which would have been unchanged from the June reading.
The jobs-to-applicant ratio ticked down to 1.29, shy of forecasts for 1.30, which again would have been unchanged.
The participation rate was 63.1 percent, matching forecasts and steady from the June level.
News are provided by
InstaForex.
Read More
-
30-08-2023, 05:21 AM #3933Senior Investor
- Join Date
- Jun 2012
- Posts
- 3,492
- Feedback Score
- 0
- Thanks
- 0
- Thanked 9 Times in 9 Posts
This week's pack of US data will decide the dollar's fate
This week, the news backdrop will be much stronger than in the previous one. The lion's share of essential reports will come from America, so I will focus on them in this article. Before delving into the data that could significantly affect the dollar's fate, I should note – the labor market and unemployment reports are currently the most crucial because they, along with inflation, influence when the Federal Reserve will stop raising rates and start lowering them. Reports on GDP or business activity are nowhere near as influential as the aforementioned ones.
The first significant report will be released on Tuesday – the JOLTS number of job openings. It's expected that this figure will slightly fall compared to the previous month, but it's rare for the actual value to deviate significantly from market expectations. Hence, while the report is important, the dollar's reaction will depend on the actual figure, which could be neutral.
The second key report is the ADP report on changes in employment in the non-farm sector. This is analogous to the Nonfarm Payrolls but with lesser significance to the market. Reactions to this report are quite frequent, and its values often do not meet market expectations. However, the market values payrolls more, and the final assessment of the labor market's state will be based on the payrolls. Nonetheless, a reaction to the ADP report might also follow.
The third important report is the unemployment rate on Friday. It is expected that for August, the unemployment rate will remain unchanged at 3.5%. However, its increase or decrease can greatly influence market sentiment. I believe that a slight increase will not lead to a decline in the dollar, as this indicator has been near its historical lows for a long time.
The fourth important report is Nonfarm Payrolls, which will be released at the same time as the unemployment report. Payrolls are more significant, and their value has been declining for some time. However, this should not cause confusion, as the FOMC continually tightens its monetary policy, leading to an economic slowdown. Accordingly, the relationship between expectation and reality will be significant here. The forecast is 170,000. Any value above this might cause an increase in demand for the dollar. And the payroll report will most likely overshadow the unemployment report.
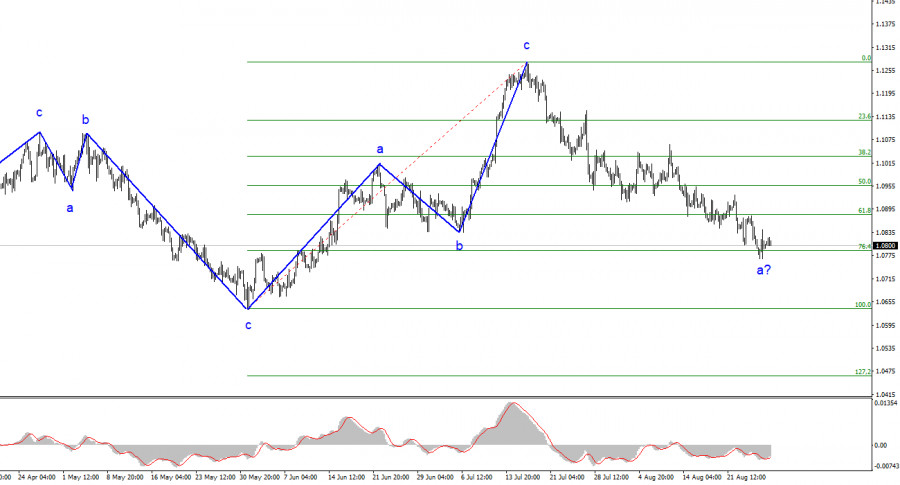
Based on the conducted analysis, I came to the conclusion that the upward wave pattern is complete. I still believe that targets in the 1.0500-1.0600 range are quite realistic, and with these targets in mind, I advise selling the instrument. The a-b-c structure appears complete and convincing. Therefore, I advise selling the instrument with targets set around the 1.0788 and 1.0637 marks. I believe that the construction of a downtrend segment will continue, but a corrective wave might start soon.
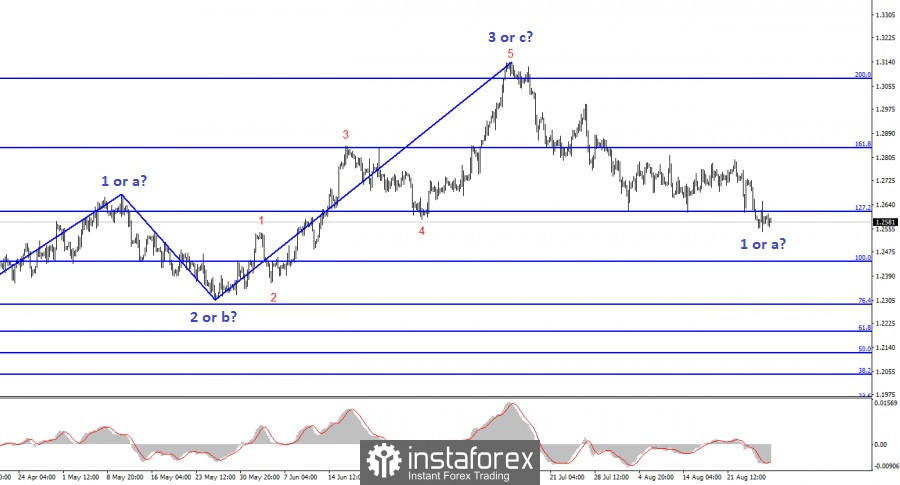
The wave pattern of the GBP/USD pair suggests a decline within the downtrend segment. There is a risk of ending the current downward wave if it is wave "d" and not "1". In that case, wave 5 could start from current levels. However, in my opinion, we are currently witnessing the construction of the first wave as part of a new downward segment of the trend. A successful attempt to break through the 1.2618 mark, corresponding to 127.2% Fibonacci, indicates the market's readiness for new short positions. I advise selling with targets set around the 1.2443 mark.
Analysis are provided by InstaForex.
Read More
-
30-08-2023, 05:45 AM #3934Senior Investor
- Join Date
- Jun 2012
- Posts
- 3,492
- Feedback Score
- 0
- Thanks
- 0
- Thanked 9 Times in 9 Posts
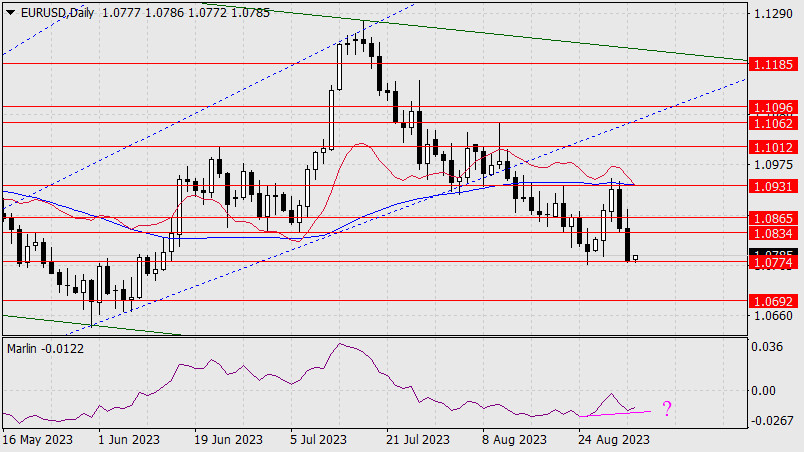
Forecast for EUR/USD on August 30, 2023
EUR/USD
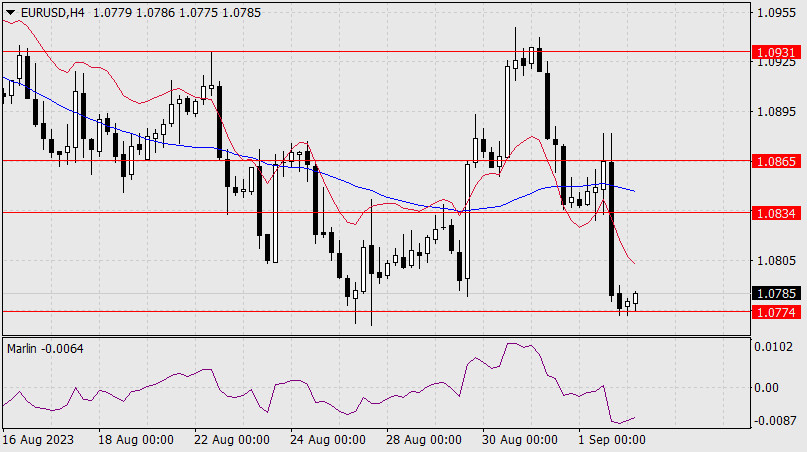
On Tuesday, the euro tried to approach the support level of 1.0774, but the bulls held on to their strong positions, and as a result, the euro closed the day above the resistance level of 1.0865. The single currency started the day with a bearish correction, but eventually, it will try to test the resistance at 1.0931, above which the MACD line lies. The Marlin oscillator is also approaching the boundary of the uptrend territory. If the price surpasses 1.0931 concurrently with Marlin moving into the growth territory, the euro might receive another support for growth. Potential bullish targets are: 1.1012, 1.1062, 1.1096. This growth has a corrective nature.
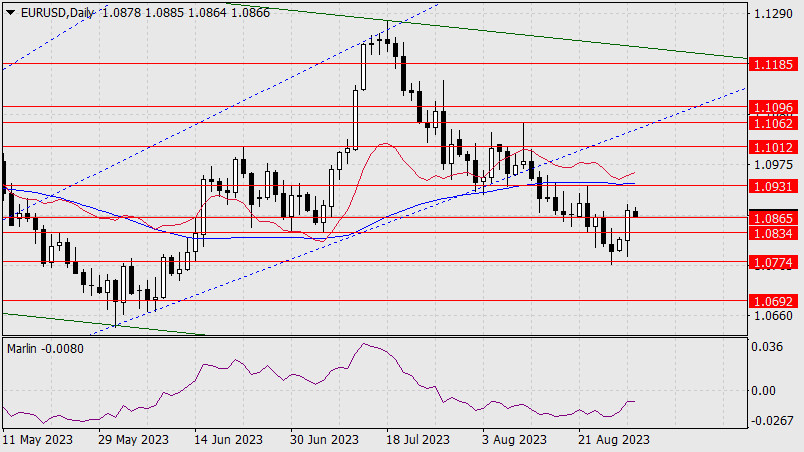
In the US, the JOLTS Jobs Openings slowed to 8.82 million in July, well off the estimate of 9.46 million, and June data was revised downwards from 9.582 million to 9.165 million. In Japan, July unemployment increased from 2.5% to 2.7% (the forecast was for it to remain unchanged). Our assumption about the labor market in the US and worldwide losing steam seems justified. We anticipate weak employment data on Friday and the euro to rise further.
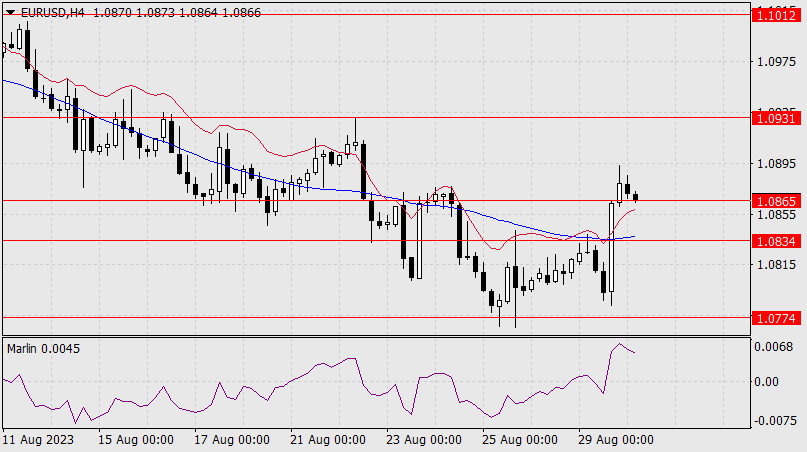
On the four-hour chart, the price has settled above the balance and MACD indicator lines, above the 1.0865 level. The Marlin oscillator has sharply jumped. In such a scenario, the price may consolidate and rise further.
Analysis are provided by InstaForex.
Read More
-
31-08-2023, 05:56 AM #3935Senior Investor
- Join Date
- Jun 2012
- Posts
- 3,492
- Feedback Score
- 0
- Thanks
- 0
- Thanked 9 Times in 9 Posts
USDCHF, H4 | Bounce off support?
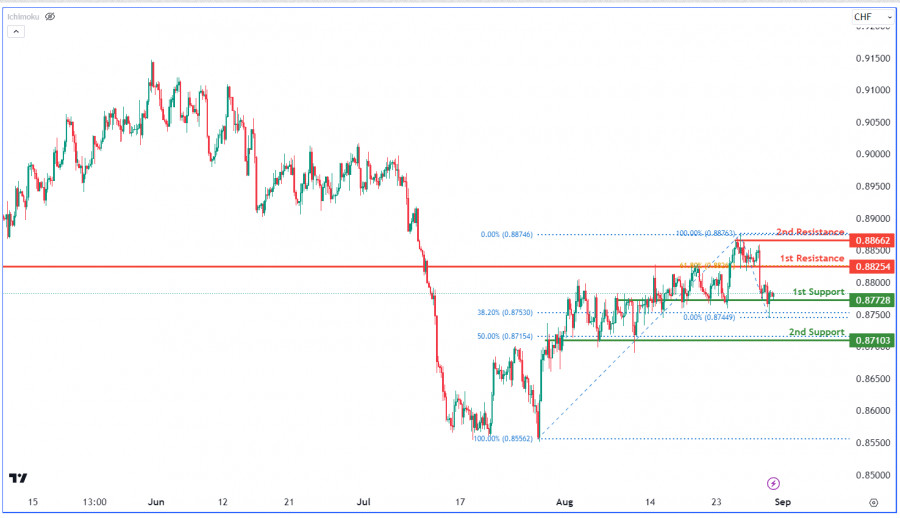
The USD/CHF chart exhibits bullish momentum. Potential rebound from 1st support to 1st resistance. 1st support at 0.8772 and 2nd support at 0.8710 (50% Fibonacci Retracement) are crucial. Conversely, 1st resistance at 0.8825 (61.80% Fibonacci Retracement) resists, and 2nd resistance at 0.8866 signifies multi-swing high resistance. These levels indicate potential price reactions.
Analysis are provided by InstaForex.
Read More
-
01-09-2023, 05:51 AM #3936Senior Investor
- Join Date
- Jun 2012
- Posts
- 3,492
- Feedback Score
- 0
- Thanks
- 0
- Thanked 9 Times in 9 Posts
Forecast for GBP/USD on September 1, 2023
GBP/USD
As a result of yesterday, the pound fell by 46 points, returning below the 1.2684 level. The signal line of the Marlin oscillator on the daily chart isn't in a hurry to move downwards; on the contrary, it indicates an intent to rise above the zero line.
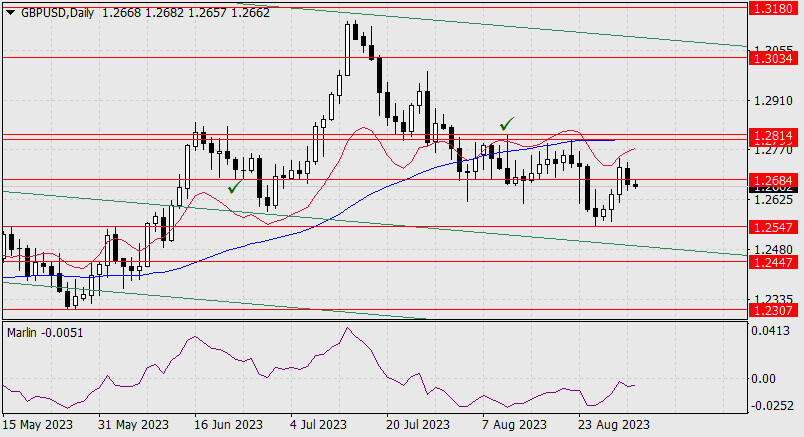
If the pound realizes this intention, then the pair could rise in the target range of 1.2799-1.2814. Traders across markets are eagerly awaiting today's US employment data for August. If they turn out to be strong, the pound might head towards 1.2547.
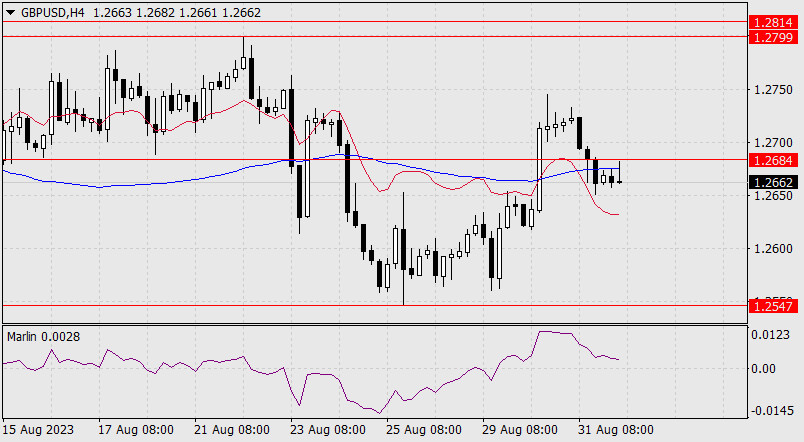
On the four-hour chart, the price consolidated below the MACD indicator line, with the Marlin oscillator in a waiting position in the uptrend territory. While waiting for the US data, the price might rise above 1.2684, which would significantly improve the bulls' positions.
Analysis are provided by InstaForex.
Read More
-
04-09-2023, 06:02 AM #3937Senior Investor
- Join Date
- Jun 2012
- Posts
- 3,492
- Feedback Score
- 0
- Thanks
- 0
- Thanked 9 Times in 9 Posts
Forecast for EUR/USD on September 4, 2023
EUR/USD
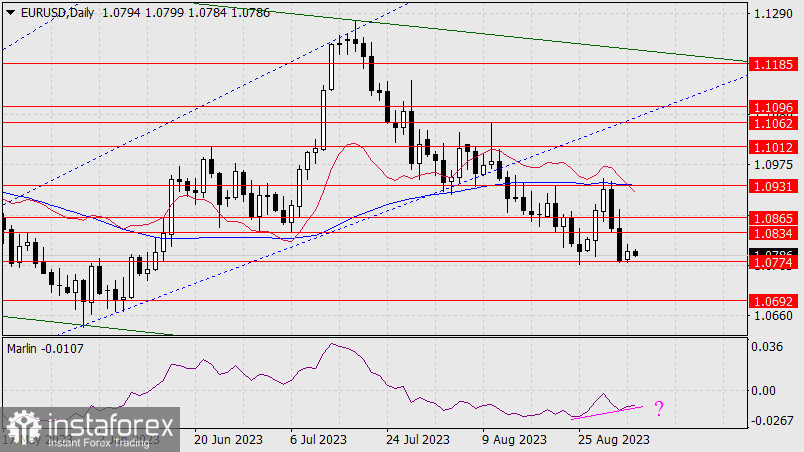
The short-term battle of speculators with the release of US employment data ended in favor of the dollar bulls. The dollar index rose by 0.58%, US government bond yields increased (from 4.25% to 4.30% for 5-year bonds), and stock markets closed mixed. The euro lost 66 pips, reaching the target support at 1.0774. Is this a signal or condition for a medium-term decline? At the very least, we need to wait for the price to settle below 1.0774. Next, we need to confirm a confident reversal of the S&P 500. In other words, the initial conditions can only emerge tomorrow. If this doesn't happen, the euro may rise again, attempting to surpass 1.0931 (MACD line).
We currently have a downtrend on the daily chart, so the nearest target is the level of 1.0692. Overcoming this target could result in the pair aiming for the 1.0483-1.0552 range, which includes the descending price channel line and the Fibonacci retracement level.
There is also potential for a bullish scenario, indicated by the emerging convergence between price and the Marlin oscillator.
If the pound realizes this intention, then the pair could rise in the target range of 1.2799-1.2814. Traders across markets are eagerly awaiting today's US employment data for August. If they turn out to be strong, the pound might head towards 1.2547.
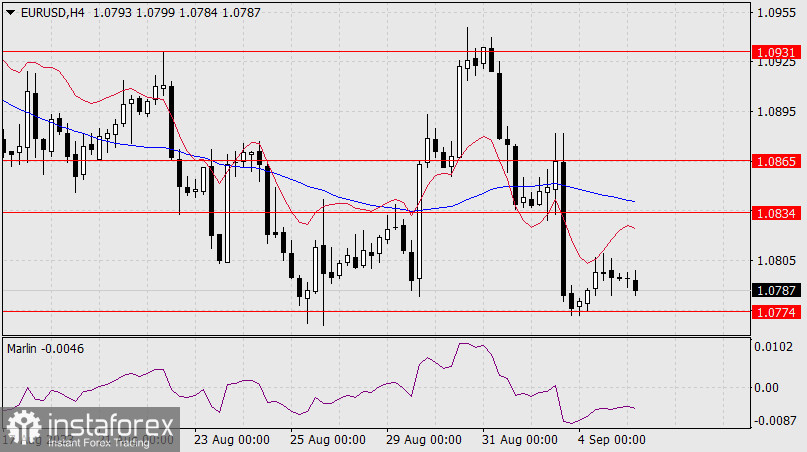
On the four-hour chart, the price has paused at the target support of 1.0774. Consolidating below this level will allow the price to reach the target at 1.0692, but the euro can only reach this level if the stock market remains weak.
Analysis are provided by InstaForex.
Read More
-
05-09-2023, 06:23 AM #3938Senior Investor
- Join Date
- Jun 2012
- Posts
- 3,492
- Feedback Score
- 0
- Thanks
- 0
- Thanked 9 Times in 9 Posts
Forex Analysis & Reviews: Forecast for EUR/USD on September 5, 2023
EUR/USD Yesterday, the euro gained 19 pips despite a relatively muted day. From a technical perspective, the situation has not changed. A close below 1.0774 would pave the way for the bears to reach 1.0692. However, there is a nuance here – it could break the support or a false consolidation to create a distinct convergence with the oscillator rather than leaving it weak as we see it now. On the other hand, it could gradually rise towards the nearest resistance level at 1.0834, then 1.0865, and ultimately 1.0931.
On the 4-hour chart, we have a neutral situation because the price is moving sideways within the 1.0774-1.0834 range. The Marlin oscillator is also moving sideways, and the price is below both indicator lines, and there is no clear direction.
There are no clues on the external side. In the euro area, the composite PMI index for August is expected to fall from 48.6 to 47.0. In the United States, factory orders for July are expected to drop by 2.5%. We await further developments.
Analysis are provided by InstaForex.
Read More
-
06-09-2023, 05:54 AM #3939Senior Investor
- Join Date
- Jun 2012
- Posts
- 3,492
- Feedback Score
- 0
- Thanks
- 0
- Thanked 9 Times in 9 Posts
Forex Analysis & Reviews: EUR/USD. Why is the dollar appreciating?
The US Dollar Index rose to a near six-month high on Tuesday. Currency pairs of the "major" group changed their configuration accordingly. In particular, the EUR/USD pair plummeted to the 1.0717 level, dropping to its lowest point in nearly three months. Moving forward, traders should be cautious about the current price dynamics. Short positions appear risky despite the swift and sharp decline in price.
Overall, Tuesday's "downward breakout" is solely due to the dollar's strength. At first glance, the greenback has strengthened without any apparent reason, given the nearly empty economic calendar. The primary reason for this has a deeper, more global nature: the dollar is trading higher amid a risk off mood. The US economy is showing signs of resilience, while there are signs that China and Europe are slowing, disappointing investors with declines in key macroeconomic indicators.

The US dollar received support from Chinese fundamental data. Notably, the decline of the Caixin Services PMI reading to 51.8 in August from 51.9 in July, missing market forecasts of an increase to 53.4 points. This is the lowest reading since January. This disappointing result has renewed concerns about the slowdown in the Chinese economy. In response to this report, the Shanghai Composite Index fell by nearly 1%, and the Hang Seng Index dropped by almost 2%.
This report should be considered in conjunction with other reports published in China over the past few weeks. For instance, China's manufacturing PMI rose to 49.7 in August from 49.3 in July. This reading has been below the 50-point mark for the fifth consecutive month. China's non-manufacturing activity index also fell short of the forecast, rising to 51.0 against expectations of 51.3. While it remains "above the waterline," the downtrend has persisted for six months.
At the end of August, The Wall Street Journal published an article on the prospects of China's economic growth. It was quite pessimistic: surveyed economists concluded that the economic model that took China to great-power status seems broken. Weak Chinese fundamental data in July and August (GDP data, trade figures, industrial indicators, PMIs) only illustrated the resounding material from WSJ.
Weak growth in other countries, primarily China and the EU, prompts market participants to acquire the US dollar. Furthermore, according to some experts, the resilient US economy, combined with high inflation (slow decreases in inflation figures), "guarantee" that the Federal Reserve's interest rate will remain high for a long time.
Recent US economic reports indicate that the American economy is feeling fairly confident, despite the extensive and rather aggressive tightening of the Fed's monetary policy. In particular, Goldman Sachs trimmed its prediction for the chance of a recession in the US to 15% from 20%. Therefore, discussions about rate cuts in early next year have essentially been put to rest. Moreover, markets are pricing in another round of rate hikes by the Fed by the end of this year (a 40% probability of a rate hike in November).
At the same time, European reports, for the most part, have been disappointing (PMIs, IFO indices), and representatives of the European Central Bank are expressing concerns about the pace of economic growth in the eurozone. The recently published minutes of the ECB's July meeting also reflected negative trends: ECB members agreed with the chief economist of the ECB that the near-term economic prospects of the eurozone had "deteriorated significantly." Such a news flow has sparked rumors that the central bank may need to start lowering interest rates in the first half of next year. Moreover, the probability of an ECB rate hike in September has decreased to around 30%. Underwhelming China macro data (the EU's largest trading partner) only adds fuel to the fire, simultaneously sparking a risk-off sentiment in the markets.
The dollar, in turn, is benefiting from this situation. On Tuesday, the euro slipped further amid risk-aversion, allowing bears to exit the 8-figure territory and establish a new price range between 1.0710 and 1.0800.
The oil market has also provided more (indirect) support to the greenback, as spike in oil prices reignited fears about US inflation accelerating. Brent crude futures rose above $90 per barrel (the first time since November 18, 2022) on news that Saudi Arabia and Russia are extending voluntary oil production cuts by a combined 1.3 million b/d.
Considering that the EUR/USD pair has approached the lower band of the aforementioned price range (1.0710 - the lower Bollinger Bands line on the daily chart), it's better to be cautious with short positions. In this case, it would be wise to either wait for a bullish correction (to enter short positions aiming for 1.0710) or a breakdown of the support level. In the latter case, the next target for the downward movement will be the 1.0640 level, which is the lower Bollinger Bands line on the weekly chart.
Analysis are provided by InstaForex.
Read More
-
07-09-2023, 06:31 AM #3940Senior Investor
- Join Date
- Jun 2012
- Posts
- 3,492
- Feedback Score
- 0
- Thanks
- 0
- Thanked 9 Times in 9 Posts
Forecast for GBP/USD on September 7, 2023
GBP/USD
The pound has reached an important support level from the embedded line of the global descending price channel. The brewing convergence with the Marlin oscillator on the daily chart warns of a price reversal which indicates a deep correction, possibly towards the range of 1.2799-1.2814, i.e. to the MACD indicator line.
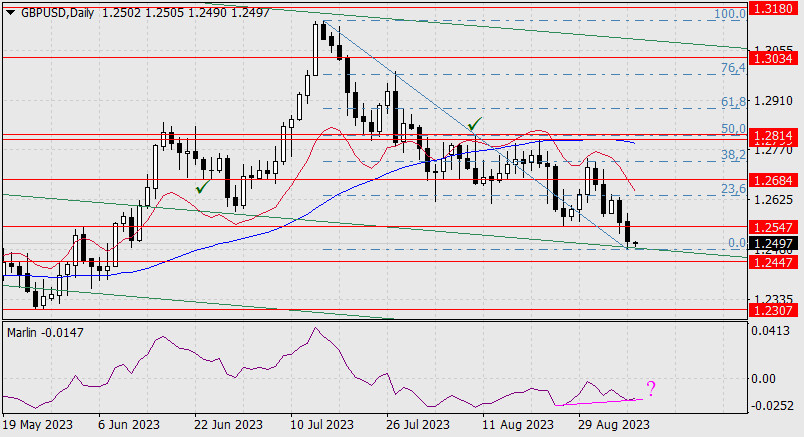
According to the Fibonacci retracement, such a correction would be 50.0%. If the price reaches the support at 1.2447 and turns around, the Fibonacci levels will also be corrective in nature, marking the lows of August 3 and 14 at 23.6%. Once we confirm that the price has settled below 1.2447, we can then consider 1.2307 as a target.
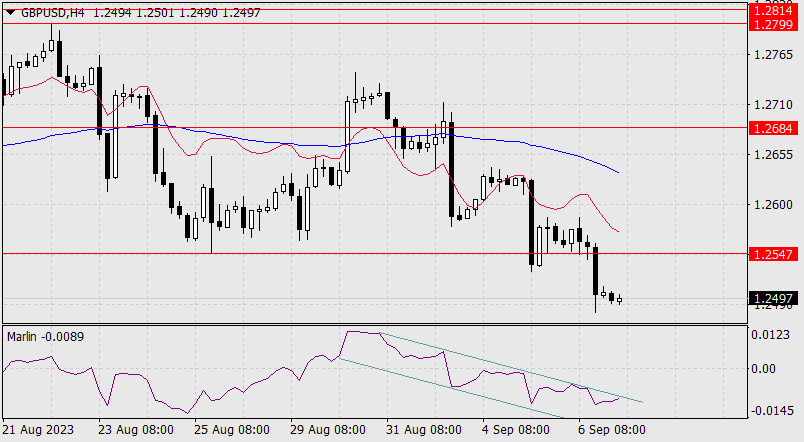
On the 4-hour chart, the price is rhythmically declining below the indicator lines, and the Marlin oscillator is developing in a descending channel but already shows an intention to leave this area by moving upwards. Yesterday's decline was caused by Bank of England Governor Andrew Bailey's speech in Parliament, where he mentioned reaching the peak of interest rates. However, markets still expect the last rate hike in early 2024, and such sentiment won't hinder corrective growth.
Analysis are provided by InstaForex.
Read More
-
Sponsored Links


 Reply With Quote
Thread Information
Users Browsing this Thread
There are currently 1 users browsing this thread. (0 members and 1 guests)
 Posting Permissions
24 Hour Gold

Advertising
- Over 20.000 UNIQUE Daily!
- Get Maximum Exposure For Your Site!
- Get QUALITY Converting Traffic!
- Advertise Here Today!
Out Of Billions Of Website's Online.
Members Are Online From.
- Get Maximum Exposure For Your Site!
- Get QUALITY Converting Traffic!
- Advertise Here Today!
Out Of Billions Of Website's Online.
Members Are Online From.


