
 LinkBack URL
 About LinkBacks
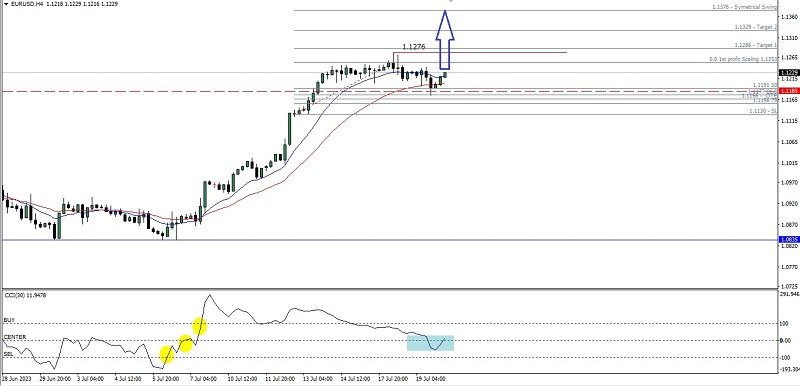
Technical Analysis of Intraday Price Movement of EUR/USD Main Currency Pairs, Thursday, July 20 2023
If we look on its 4 hour chart, EUR/USD main currency pairs seems like Buyers still dominates where this things confirmed by EMA 12 & 26 which is still intersecting Golden Cross as well as indicator CCI which manages to break above its three levels and hold on to the level 0 which indicates that there is significant support based on these facts, in the near future Fiber has the potential to rally up to test the 1.1253 level. If this level is successfully broken up, then the 1.1276 level will be the main target to aim for and the 1.1329-1.1376 area level will be the next target to go for. However, all of these strengthening scenarios will cancel itself out if on the way the EUR/USD rally goes up towards the target levels, it is suddenly corrected downwards and breaks below the 1.1134 level because if this level is successfully broken down then all strengthening rally scenarios previously described will become invalid and cancel automatically.
Analysis are provided by InstaForex.
Read More
Please visit our sponsors
Results 3,901 to 3,910 of 4086
Thread: InstaForex Wave Analysis
-
20-07-2023, 06:09 AM #3901Senior Investor


- Join Date
- Jun 2012
- Posts
- 3,492
- Feedback Score
- 0
- Thanks
- 0
- Thanked 9 Times in 9 Posts

-
21-07-2023, 06:08 AM #3902Senior Investor
- Join Date
- Jun 2012
- Posts
- 3,492
- Feedback Score
- 0
- Thanks
- 0
- Thanked 9 Times in 9 Posts
NZDUSD, H4 | Bounce off support level?
The NZD/USD pair is in a bearish trend, breaking below an ascending support line and suggesting a potential continuation of the downward movement. The first support at 0.6189, aligned with the 61.8% Fibonacci retracement, could act as a price floor. If the price drops further, the second support at 0.6114, aligned with the 78.6% Fibonacci retracement, may provide strong resistance.
On the other hand, if the bearish momentum reverses, the price could face resistance at 0.6246, followed by a higher obstacle at 0.6305. These resistance levels have the potential to hinder the price's upward progress.
Analysis are provided by InstaForex.
Read More
-
21-07-2023, 07:47 AM #3903Senior Investor

- Join Date
- Jul 2011
- Location
- www.ArmadaMarkets.com
- Posts
- 4,127
- Feedback Score
- 0
- Thanks
- 0
- Thanked 2 Times in 2 Posts
The ability to analyze has a very crucial impact on our success in forex trading. That is why developing analytical skills is essential. By doing so, traders can accurately analyze the market and gain profits while trading with Tickmill broker.
-
24-07-2023, 05:44 AM #3904Senior Investor
- Join Date
- Jun 2012
- Posts
- 3,492
- Feedback Score
- 0
- Thanks
- 0
- Thanked 9 Times in 9 Posts
Forecast for GBP/USD on July 24, 2023
GBP/USD:
On Friday, the British pound traded in a 43-pip range, slightly decreasing by the end of the day. The Marlin oscillator has entered the downward territory, strengthening the pound's potential to test the support level at 1.2666-1.2720.
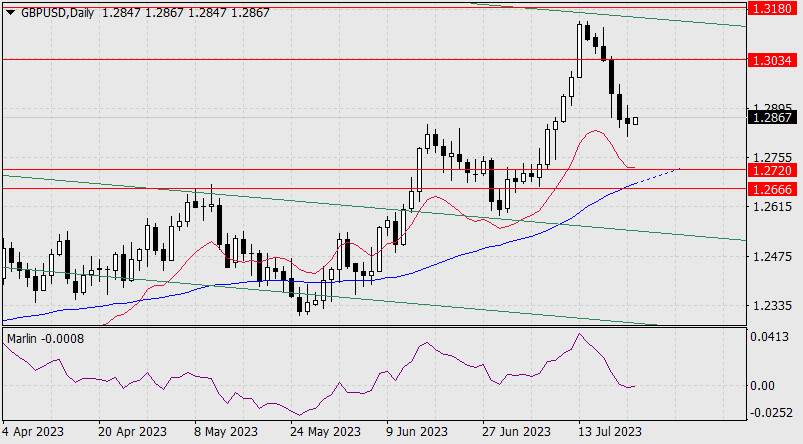
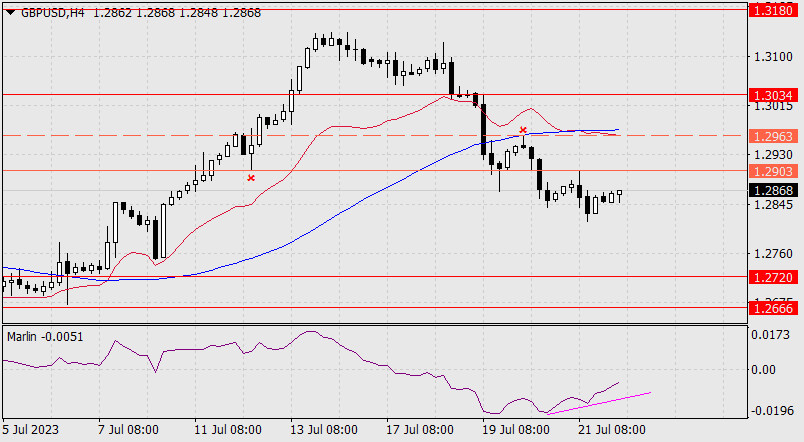
The MACD line has become significant within the mentioned range. The price will likely fall after breaking below Friday's low at 1.2815. On the four-hour chart, we can see that the price tested the nearest correction level at 1.2903 with the upper shadow on Friday. The price and oscillator convergence is gradually waning.
If today's UK business activity gauge shows that the Manufacturing PMI is slowing down as expected, while the US Manufacturing PMI is getting stronger (forecast of 46.4 versus 46.3 in May), then the pound will likely fall towards the upper band of the target range at 1.2720.
Analysis are provided by InstaForex.
Read More
-
25-07-2023, 06:12 AM #3905Senior Investor
- Join Date
- Jun 2012
- Posts
- 3,492
- Feedback Score
- 0
- Thanks
- 0
- Thanked 9 Times in 9 Posts
Forex Analysis & Reviews: Forecast for AUD/USD on July 25, 2023
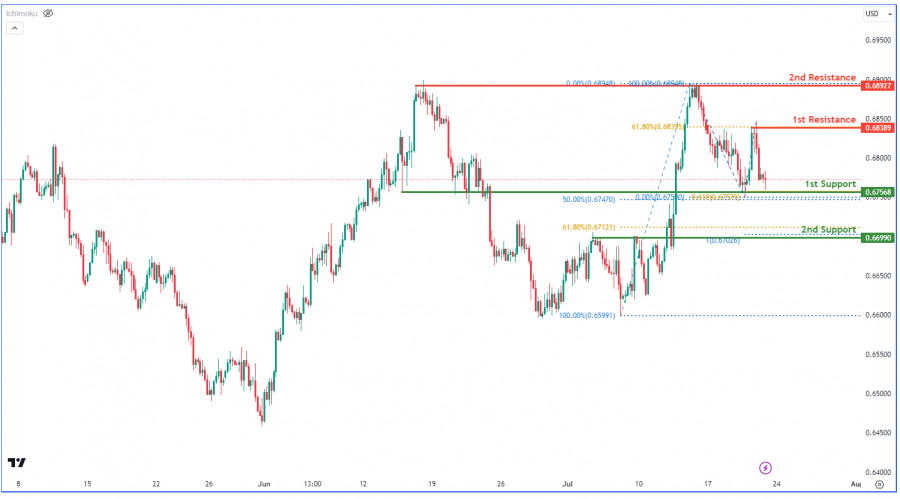
AUD/USD: The Australian Dollar, unlike other currencies, clearly indicates a potential decline in the US Dollar after the Federal Reserve's rate hike tomorrow. The signs include a price reversal at the approaching signal line of 0.6708 and a false break of the Marlin oscillator's signal line below the zero line.
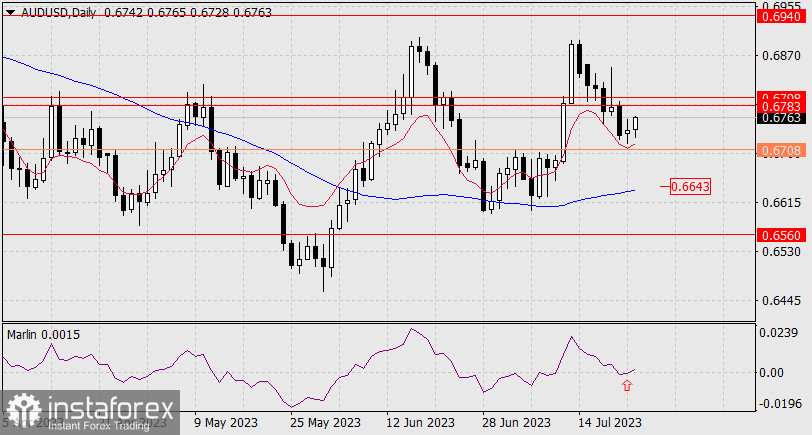
Currently, the Marlin oscillator is in positive territory. If the price breaks above the target range of 0.6783/98, there is potential for further growth towards the target level of 0.6940. On the other hand, if the price breaks below the signal level of 0.6708, it may aim to test the MACD line around 0.6643 with a perspective of declining to 0.6560.
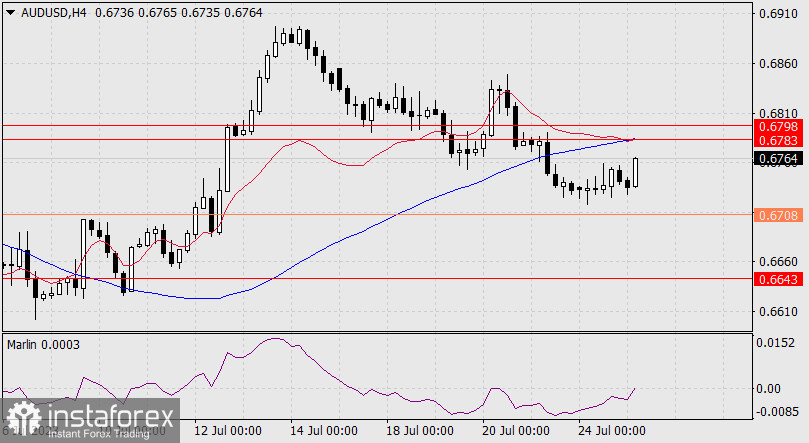
On the four-hour chart, the Marlin oscillator has moved into the upward territory, and the price shows an intention to enter the target range of 0.6783/98, which would also mean breaking above the MACD line. The FX market awaits the outcome of tomorrow's Fed meeting.
Analysis are provided by InstaForex.
Read More
-
26-07-2023, 05:18 AM #3906Senior Investor
- Join Date
- Jun 2012
- Posts
- 3,492
- Feedback Score
- 0
- Thanks
- 0
- Thanked 9 Times in 9 Posts
NZDUSD, H4 | React off Resistance level?
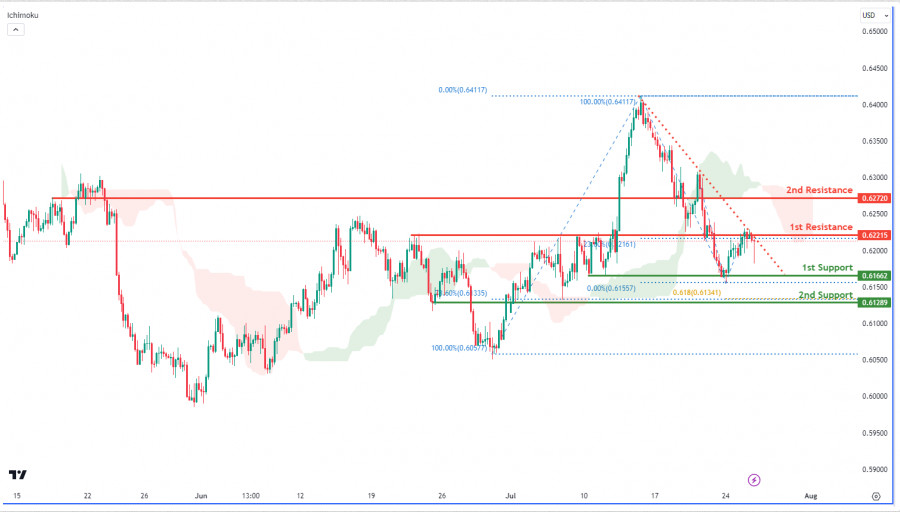
The NZD/USD chart is currently trending bearish, with the price within a bearish Ichimoku cloud and below a major descending trend line, indicating potential further decline. The 1st support at 0.6166, a multi-swing low, and the 2nd at 0.6128, an overlap support and the 78.60% Fibonacci retracement, could halt the bearish run. Resistance levels are at 0.6221 and 0.6272, acting as overlap and pullback resistances respectively, potentially sparking selling pressure.
Analysis are provided by InstaForex.
Read More
-
26-07-2023, 05:31 AM #3907Senior Investor

- Join Date
- Dec 2019
- Posts
- 2,107
- Feedback Score
- 0
- Thanks
- 0
- Thanked 0 Times in 0 Posts
Absolutely, the ability to analyze is incredibly crucial in forex trading, and as a trader, one must be skilled at accurately analyzing the market. This is done to ensure that they can easily gain profits with Tickmill broker. Precise market analysis helps traders make well-informed decisions, identify potential entry and exit points, and manage their risk effectively. It is a valuable skill that can significantly impact a trader's success in the forex market.
-
27-07-2023, 07:16 AM #3908Senior Investor
- Join Date
- Jun 2012
- Posts
- 3,492
- Feedback Score
- 0
- Thanks
- 0
- Thanked 9 Times in 9 Posts
XAUUSD, H4 | React off Resistance level?
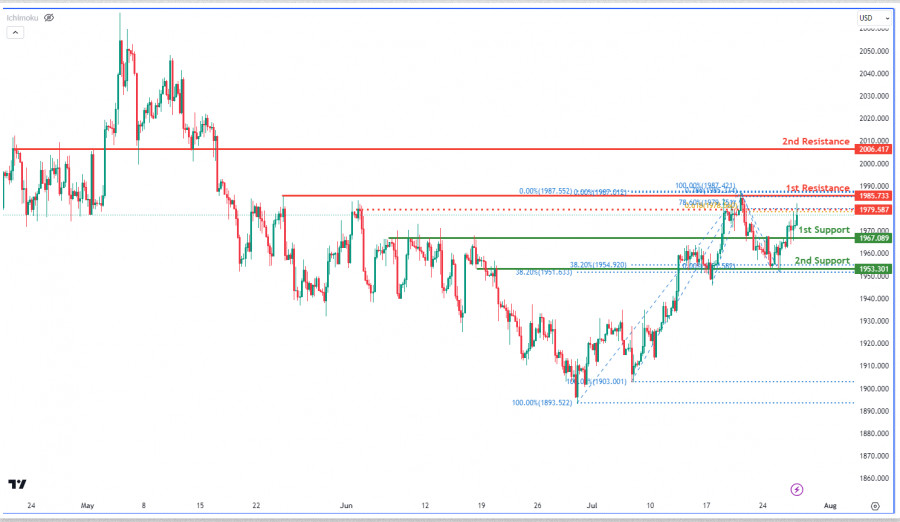
XAU/USD exhibits a bullish momentum, potentially continuing towards the first resistance at 1985.73. The first support at 1967.08 is significant as an overlap support. The second support at 1953.30 is an overlap support, positioned at both the 38.20% Fibonacci retracement level and the 38.20% Fibonacci retracement level, indicating a Fibonacci confluence. Regarding resistance levels, the second resistance at 2006.41 is notable as a pullback resistance. An intermediate resistance at 1979.00 is recognized as a pullback resistance, positioned at both the 78.60% Fibonacci retracement level and the 61.80% Fibonacci projection level, indicating a Fibonacci confluence.
Analysis are provided by InstaForex.
Read More
-
28-07-2023, 06:28 AM #3909Senior Investor
- Join Date
- Jun 2012
- Posts
- 3,492
- Feedback Score
- 0
- Thanks
- 0
- Thanked 9 Times in 9 Posts
XAUUSD, H4 | React off Resistance level?
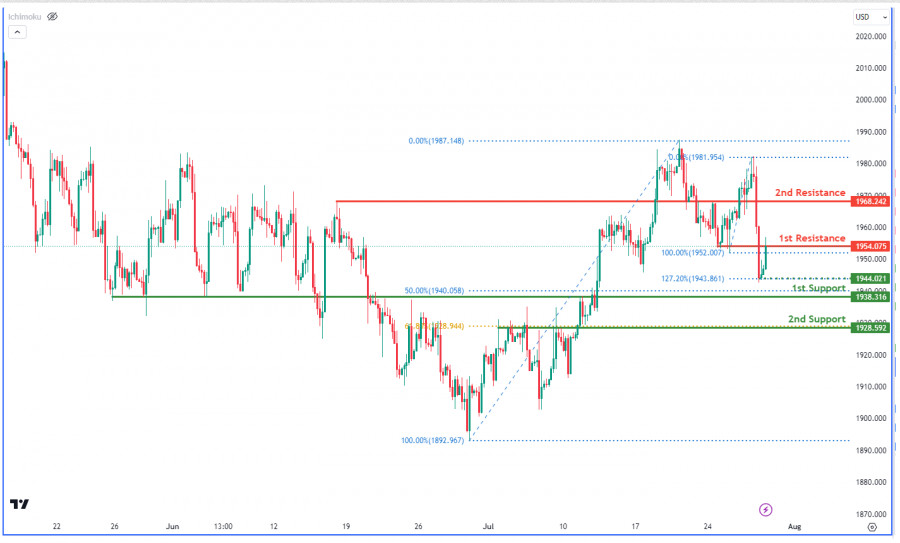
The XAU/USD pair is showing a bearish trend, potentially leading to a price drop from the 1st resistance level towards the 1st support at 1938.31, significant due to its pullback support and 50% Fibonacci retracement alignment. If the price breaches this level, the 2nd support at 1928.59, an overlap support and the 61.80% Fibonacci retracement level, is notable. Resistance levels are at 1954.07 (pullback) and 1968.24 (pullback), both likely hindrances for upward price movement.
Analysis are provided by InstaForex.
Read More
-
31-07-2023, 04:17 AM #3910Senior Investor
- Join Date
- Jul 2011
- Location
- www.ArmadaMarkets.com
- Posts
- 4,127
- Feedback Score
- 0
- Thanks
- 0
- Thanked 2 Times in 2 Posts
The ability to analyze is a crucial and influential factor, and I personally always strive to sharpen my analytical skills. This is done to foster growth and to be able to analyze the market accurately on a real account with Tickmill as the chosen broker.
-
Sponsored Links


 Reply With Quote
Thread Information
Users Browsing this Thread
There are currently 3 users browsing this thread. (0 members and 3 guests)
 Posting Permissions
24 Hour Gold

Advertising
- Over 20.000 UNIQUE Daily!
- Get Maximum Exposure For Your Site!
- Get QUALITY Converting Traffic!
- Advertise Here Today!
Out Of Billions Of Website's Online.
Members Are Online From.
- Get Maximum Exposure For Your Site!
- Get QUALITY Converting Traffic!
- Advertise Here Today!
Out Of Billions Of Website's Online.
Members Are Online From.


