
 LinkBack URL
 About LinkBacks
Forex Analysis & Reviews: Technical Analysis of GBP/USD for December 9, 2022
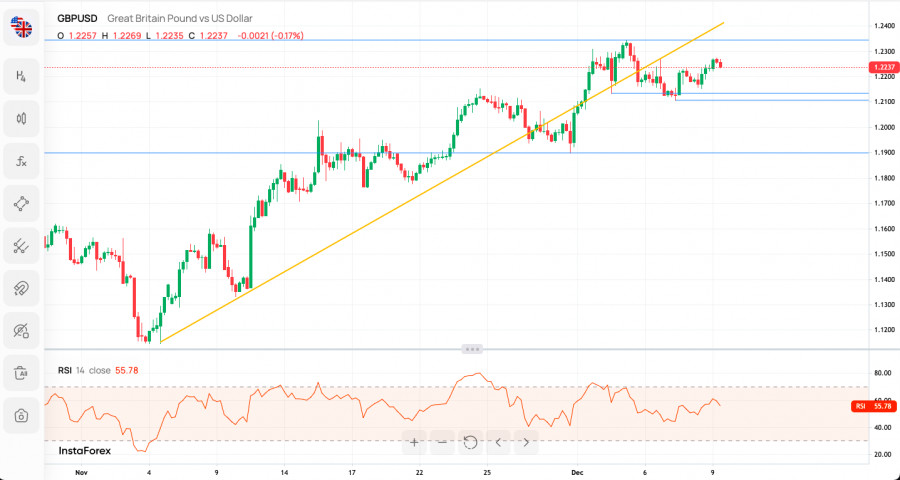
Technical Market Outlook: The GBP/USD pair has been seen bouncing up from the technical support located at 1.2106 and is moving closer to the swing high located at 1.2343. The momentum remains strong and positive which supports the short-term bullish outlook for GBP. The nearest technical support is still seen at 1.2106, so in a case of an unexpected breakout lower, the next target for bears is seen at 1.1897 (30th November low). Also, please notice the Bearish Divergence between the price and the momentum indicator that might have an impact on the next bearish movement.
Weekly Pivot Points:
WR3 - 1.24283
WR2 - 1.23713
WR1 - 1.23415
Weekly Pivot - 1.23143
WS1 - 1.22845
WS2 - 1.22573
WS3 - 1.22003
Trading Outlook:
The bulls are temporary in control of the market and the 50% Fibonacci retracement of the last big wave down located at 1.2293 had been tested, so a down trend resumption is possible. On the other hand, the level of 1.0351 has not been tested since 1985, so the down trend is strong. In order to terminate the down trend, bulls need to close the weekly candle above the level of 1.2275 (swing high from August 10th).
*The market analysis posted here is meant to increase your awareness, but not to give instructions to make a trade.
Analysis are provided by InstaForex.
Read More
Please visit our sponsors
Results 3,721 to 3,730 of 4086
Thread: InstaForex Wave Analysis
-
09-12-2022, 10:11 AM #3721Senior Investor


- Join Date
- Jun 2012
- Posts
- 3,492
- Feedback Score
- 0
- Thanks
- 0
- Thanked 9 Times in 9 Posts

-
12-12-2022, 07:13 AM #3722Senior Investor
- Join Date
- Jun 2012
- Posts
- 3,492
- Feedback Score
- 0
- Thanks
- 0
- Thanked 9 Times in 9 Posts
Forex Analysis & Reviews: Technical Analysis of Daily Price Movement of Major Currency Pairs GBP/USD, Monday, December 12 2022.
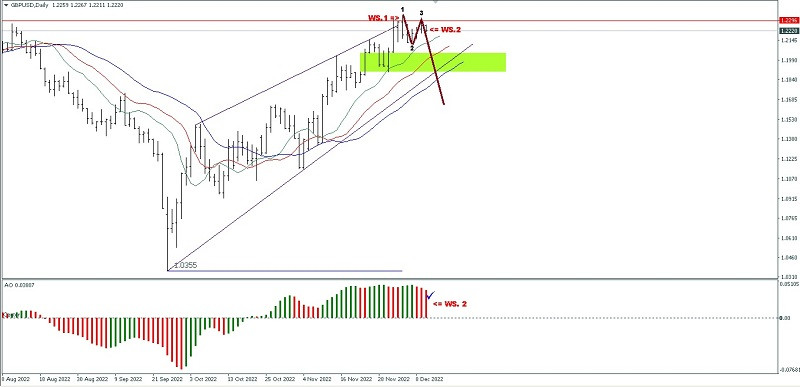
On the daily chart the main GBP/USD currency pair is starting to show signs of saturation over the rally that occurred over the previous few days, as reflected in several things:
1. 1.2296 is difficult to break upwards
2. The appearance of the Bearish = Rising Wedge pattern.
3. Formation of a Bearish pattern 123.
4. The appearance of Bearish Wiseman 1 & 2 signals.
Therefore, in the next few days, as long as Cable does not reverse its rally up above the 1.2344 level, this major currency pair still has the potential to depreciate to the 1.2045 level as its main target and if the decline has quite high volatility then it is possible that the 1.1777 level will become next target to go to.
*The market analysis posted here is meant to increase your awareness, but not to give instructions to make a trade.
Analysis are provided by InstaForex.
Read More https://ifxpr.com/3VRbTsL
-
13-12-2022, 06:11 AM #3723Senior Investor
- Join Date
- Jun 2012
- Posts
- 3,492
- Feedback Score
- 0
- Thanks
- 0
- Thanked 9 Times in 9 Posts
Forex Analysis & Reviews: Forecast for EUR/USD on December 13, 2022
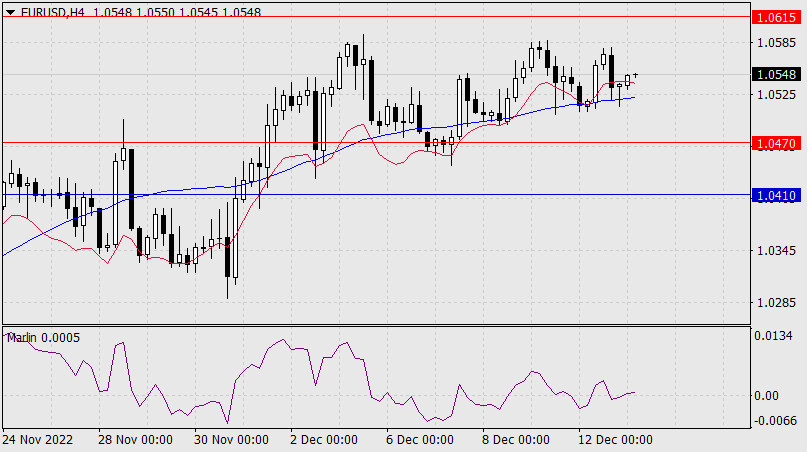
Investors raise their expectations this week, in which several central banks meetings (Federal Reserve, European Central Bank, Bank of England) are held, given the ongoing divergence between central banks' monetary policies. The Fed will become softer, while the ECB will be more hawkish. Formally, the forecast for a rate hike by all central banks is the same - 0.50%, but there has been so much talk about a surprise from the ECB that a 0.75% hike has become a forecast rather than a surprise. And that's why the euro closed Monday at the opening level despite the decline of other counter-dollar currencies.
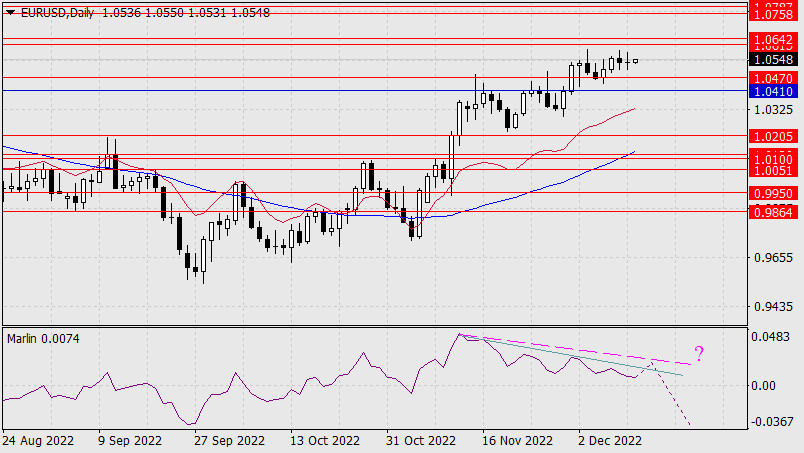
This morning, the price is trying to rise. Today's main event will be the US inflation report for November. CPI is expected to decline from 7.7% y/y to 7.3% y/y. The euro has a chance to reach the target range of 1.0615/42. If the divergence in the sentiment of the central banks is really strong, the euro may go higher, to the range of 1.0758/87 (highs in May and June).
On the four-hour chart, the price failed to fall under support of the MACD line. The last reversal from it occurred this morning. The Marlin oscillator is shifting to the upside. We expect the price to reach the first target range of 1.0615/42.
The market analysis posted here is meant to increase your awareness, but not to give instructions to make a trade.
Analysis are provided by InstaForex.
Read More
-
14-12-2022, 12:06 PM #3724Senior Investor
- Join Date
- Jun 2012
- Posts
- 3,492
- Feedback Score
- 0
- Thanks
- 0
- Thanked 9 Times in 9 Posts
Forex Analysis & Reviews: Gold to outperform Bitcoin in the long term

Goldman Sachs called gold a "more useful portfolio diversifier" and said it will outperform Bitcoin in the long term. They explained that real demand for the metal is not as affected by tightening financial conditions as the world's largest cryptocurrency, not to mention it has clear non-speculative uses unlike Bitcoin, which traders view as a stock for fast-growing technology companies. Gold is also used as a hedge against dollar devaluation and inflation.
Of course, Bitcoin could still be used as a hedge, especially since its potential comes from future use cases. But this makes it much more volatile and speculative compared to gold. Also, it surged when investors became interested in decentralized currencies, however, tighter financial conditions will not work in favor of cryptocurrency. Bitcoin's downward volatility has also been boosted by systemic concerns as several major players have declared bankruptcy.
Latest data indicates that spot gold is up 0.23% y/y, while Bitcoin is down 63%.
Going forward, gold is likely to get a boost from additional macroeconomic volatility. It could benefit from structurally higher macroeconomic volatility and the need to diversify its equity investments. Tighter liquidity should also have less impact on gold, which is more exposed to real drivers such as demand. These include physical demand, central bank purchases (which have been on record this year), investments in safe-haven assets and industrial applications.
*The market analysis posted here is meant to increase your awareness, but not to give instructions to make a trade.
Analysis are provided by InstaForex.
Read More
-
15-12-2022, 07:00 AM #3725Senior Investor
- Join Date
- Jun 2012
- Posts
- 3,492
- Feedback Score
- 0
- Thanks
- 0
- Thanked 9 Times in 9 Posts
Forex Analysis & Reviews: Technical Analysis of Intraday Price Movement of Nasdaq 100, Thursday December 15, 2022.
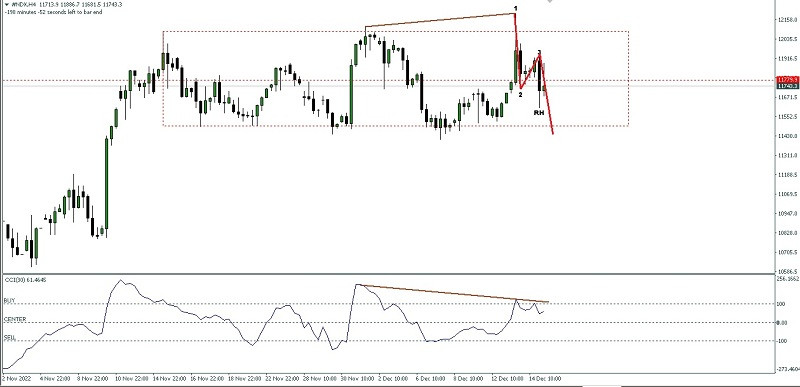
Although on its 4 hour chart Nasdaq 100 index seems move in a ranging condition but with the appearance of:
1. The deviation between price movement with CCI indicator.
2. The appearance of Bearish 123 pattern.
3. Followed by the appearance of Ross Hook (RH).
Based on three things above then in a nearest term #NDX has a potential to try to go down to test the Bearish Ross Hook level at 11608.9 if this level is successfully broken then the next level to go to is 11410.1 but if on the way to these levels there is a sudden upward correction to pass the 12007.9 level then the scenario of a decline has been described earlier will cancel by itself.
(Disclaimer)
*The market analysis posted here is meant to increase your awareness, but not to give instructions to make a trade.
Analysis are provided by InstaForex.
Read More
-
16-12-2022, 08:41 AM #3726Senior Investor
- Join Date
- Jun 2012
- Posts
- 3,492
- Feedback Score
- 0
- Thanks
- 0
- Thanked 9 Times in 9 Posts
Forex Analysis & Reviews: Trading Signal for GOLD (XAU/USD) on December 16-19, 2022: sell below $1,794 (5/8 Murray - 21 SMA)
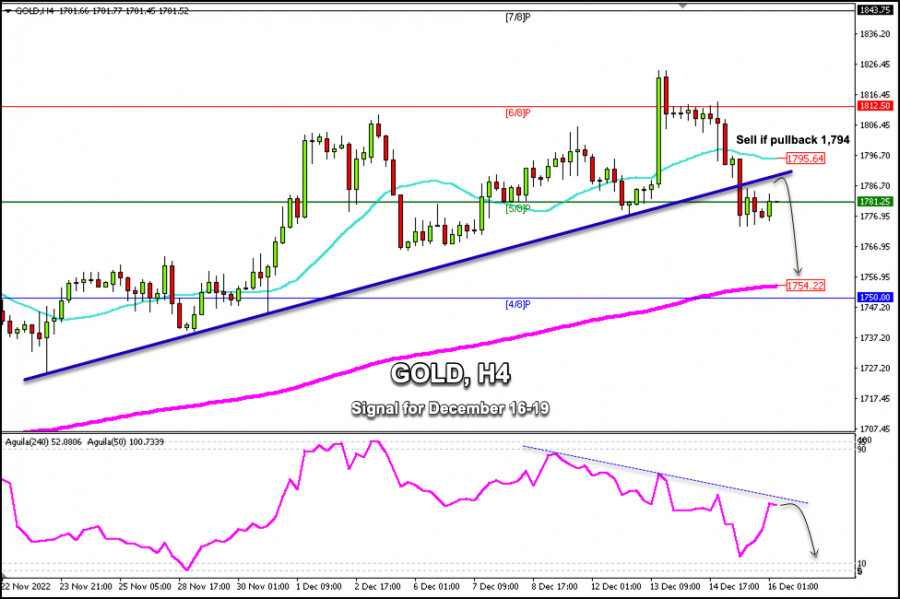
Early in the European session, gold (XAU/USD) is trading around 1,781, bouncing after hitting the low at 1,773.67.
XAU/USD is trading below the uptrend channel and below the 21 SMA (1.795). The 4-hour chart shows further downside potential. The gold price is trading in the area of strong bearish pressure. If the price consolidates below of 1,790, it could reach the level of 200 EMA around 1,754.
Since its maximum reached at 1,824 on Tuesday, gold has lost more than $50, so this weekly drop could be a sign of a probable change in trend in the short term.
Gold is expected to continue its bounce in the next few hours and can reach the area of 1,790 - 1,795. Around this level, there will be a clear signal to sell with targets at 1,781-1,755.
In case the bearish pressure persists, XAU/USD is expected to trade below the 5/8 Murray located at 1,781 and may continue to decline in the coming days until it reaches the 4/8 Murray area around 1,750.
Our trading plan is to sell gold below 1,795, targeting 1,780 at 1,754. The eagle indicator is giving a negative signal which supports our bearish strategy.
*The market analysis posted here is meant to increase your awareness, but not to give instructions to make a trade.
Analysis are provided by InstaForex.
Read More
-
19-12-2022, 08:49 AM #3727Senior Investor
- Join Date
- Jun 2012
- Posts
- 3,492
- Feedback Score
- 0
- Thanks
- 0
- Thanked 9 Times in 9 Posts
Forex Analysis & Reviews: Technical Analysis of Daily Price Movement of USD/CAD Commodity Currency Pairs, Monday, December 19 2022.
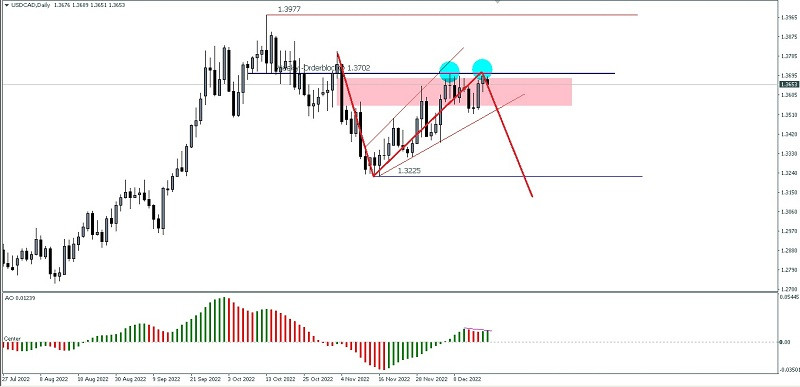
If you pay attention to the daily chart, the USD/CAD commodity currency pair appears to be stuck in the weekly Resistance Orderblock area which is quite significant at 1.3702 where at the same time a Double Top pattern (Cyan circle) is formed which is also followed by a deviation between its price movement and the Awesome Oscillator indicator, in addition to the emergence the Ascending Broadening Wedge pattern is also strengthening if in the next few days The Loonie will be brought down to the level of 1.3225 but with a note that during the fall there was no significant upward correction movement that exceeded and penetrated above the 1.3750 level because if this level is successfully broken above, the decline scenario described previously will become invalid and cancel by itself.
*The market analysis posted here is meant to increase your awareness, but not to give instructions to make a trade.
Analysis are provided by InstaForex.
Read More
-
20-12-2022, 06:58 AM #3728Senior Investor
- Join Date
- Jun 2012
- Posts
- 3,492
- Feedback Score
- 0
- Thanks
- 0
- Thanked 9 Times in 9 Posts
Forex Analysis & Reviews: Technical Analysis of Intraday Price Movement of Gold Commodity Asset, Tuesday December 2022
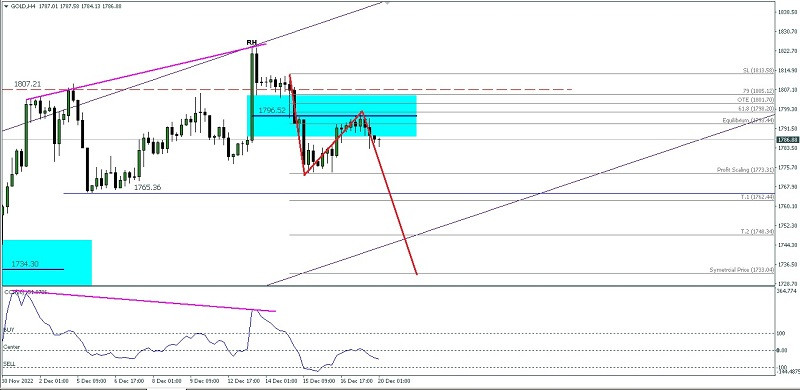
Since successfully breaking above the 1807.21 level on the 4-hour chart, gold has been pulled down again by market participants which is now that gold has tested the fairly good resistance level at 1796.52, gold is now falling back down to test the 1773.31 level. If this level is successfully broken down, gold will depreciate go down to 1762.44 as the main target and if the momentum and volatility are sufficiently supportive then the next level to aim for is 1733.04 as long as it is on the way to the target level there is no significant correction to break above the 1813.58 level where if this level is successfully penetrated upwards then a decline scenario previously described will be canceled by itself.
*The market analysis posted here is meant to increase your awareness, but not to give instructions to make a trade.
Analysis are provided by InstaForex.
Read More
-
21-12-2022, 07:00 AM #3729Senior Investor
- Join Date
- Jun 2012
- Posts
- 3,492
- Feedback Score
- 0
- Thanks
- 0
- Thanked 9 Times in 9 Posts
Forex Analysis & Reviews: Trading Signal for GOLD (XAU/USD) for December 21 - 22, 2022: sell below $1,821 and $1,809 (21 SMA - 6/8 Murray)
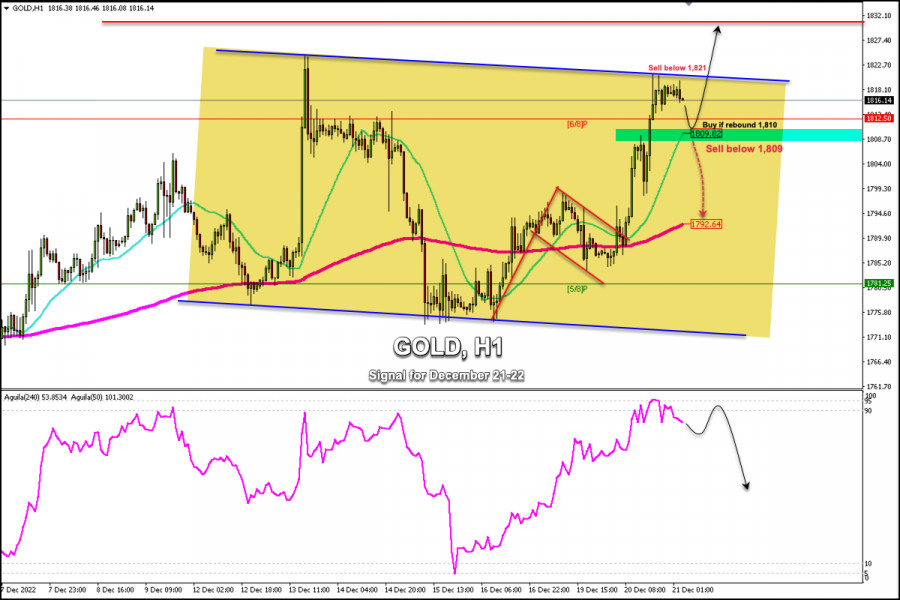
Early in the European session, Gold (XAUUSD) is trading around 1,816.14 above the 6/8 Murray and within the downtrend channel formed on December 12.
Yesterday, during the European session and the American session, gold started a strong bullish movement after it had broken the pennant pattern. In view of the fact that this pattern has completed its goal, it is probable that there will be a technical correction in the next few hours and the metal could reach the support of 1,810.
In case the uptrend continues and the price breaks above 1,821, it could accelerate the bullish move towards daily R_1 around 1,830.
Conversely, in case XAU/USD continues trading below 1,821, we could expect a decline and the price may reach the 1,810 zone. A sharp break below this level could trigger a bearish signal and we could expect a fall towards the 200 EMA located at 1,792.
Our trading plan for the next few hours is to sell below 1,821 with targets at 1,810. If gold consolidates above the 21 SMA, we can expect a technical bounce to resume buying with targets at 1,821 and 1,830.
In case gold consolidates below 1,809, it will be a clear signal to sell with targets at 1,800 and 1,793 (200 EMA). The eagle indicator on the 1-hour chart is showing overbought levels, hence, an imminent correction could occur in the next few hours.
*The market analysis posted here is meant to increase your awareness, but not to give instructions to make a trade.
Analysis are provided by InstaForex.
Read More
-
22-12-2022, 07:05 AM #3730Senior Investor
- Join Date
- Jun 2012
- Posts
- 3,492
- Feedback Score
- 0
- Thanks
- 0
- Thanked 9 Times in 9 Posts
Forex Analysis & Reviews: Technical Analysis of Intraday Price Movement of Dow Jones Industrial Average Index, Thursday December 22 , 2022.
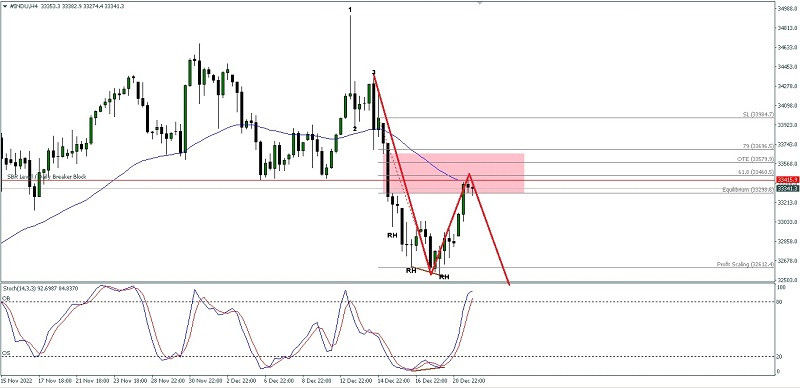
If we look at the 4-hour chart, the Dow Jones Industrial Average index seems to be corrected upwards to test the SBR (Support Become Resistance) level which also happens to be the Daily Breaker Block from #INDU, namely level 33415.9 where this level also happens to be in the Bearish Fair Value Gap area. even though the upward correction of the rally has been confirmed by the appearance of deviations between the #INDU price movement and the Stochastic Oscillator indicator, if the Resistance levels previously described are strong enough to withstand the upward correction rally and/or as long as it does not break above the 33756.6 level, then #INDU has the opportunity to fall back down to the level area 32612.4-32241.9 as the first target and the area level 31761.6-31240.1 as the second target.
*The market analysis posted here is meant to increase your awareness, but not to give instructions to make a trade.
Analysis are provided by InstaForex.
Read More
-
Sponsored Links


 Reply With Quote
Thread Information
Users Browsing this Thread
There are currently 1 users browsing this thread. (0 members and 1 guests)
 Posting Permissions
24 Hour Gold

Advertising
- Over 20.000 UNIQUE Daily!
- Get Maximum Exposure For Your Site!
- Get QUALITY Converting Traffic!
- Advertise Here Today!
Out Of Billions Of Website's Online.
Members Are Online From.
- Get Maximum Exposure For Your Site!
- Get QUALITY Converting Traffic!
- Advertise Here Today!
Out Of Billions Of Website's Online.
Members Are Online From.


