
 LinkBack URL
 About LinkBacks
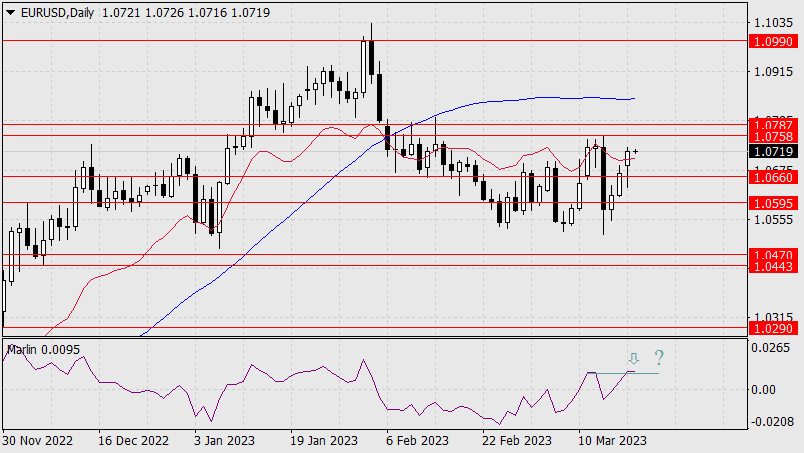
FORECAST FOR EUR/USD ON MARCH 21, 2023
Yesterday, the euro was up 53 points, having overcome not only the balance indicator line on the daily chart, but it had also gotten through the collapse of the eurozone trade balance for January at -30.6bn against the forecast of -12.5bn and -8.8bn in December. The signal line of the Marlin oscillator, which we considered in yesterday's review, reached the March 15 high, from which the oscillator, and the price behind it, may reverse to the downside.
If the price ignores today's ZEW eurozone economic sentiment indicator, which is expected to decline from 29.7 to 23.2 in the March estimate, the price might reach the 1.0758/87 target range. If expectations of the Federal Reserve's rate hike at tomorrow's meeting comes to the fore, the price will turn around towards 1.0660.
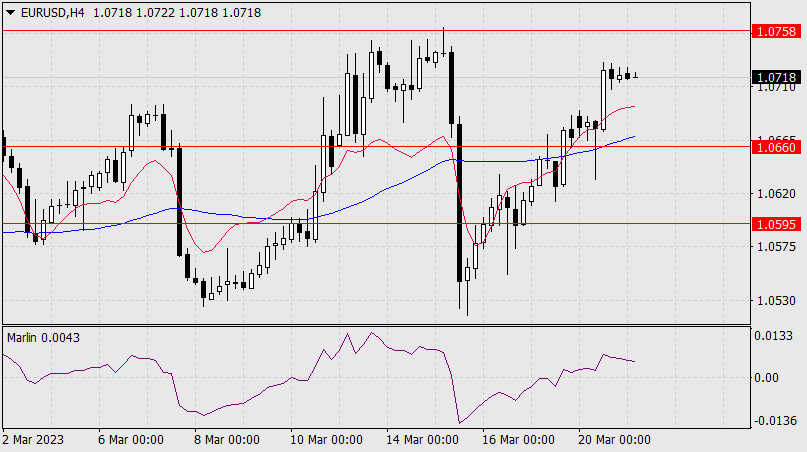
On the four-hour chart, the price is rising above the indicator lines, the Marlin oscillator is rising quietly in the area of the uptrend. In general, we can say that the price is in a neutral state. I still expect the euro to fall.
Analysis are provided by InstaForex.
Read More
Please visit our sponsors
Results 3,801 to 3,810 of 4086
Thread: InstaForex Wave Analysis
-
21-03-2023, 06:03 AM #3801Senior Investor


- Join Date
- Jun 2012
- Posts
- 3,492
- Feedback Score
- 0
- Thanks
- 0
- Thanked 9 Times in 9 Posts

-
22-03-2023, 04:47 AM #3802Senior Investor

- Join Date
- Dec 2019
- Posts
- 2,108
- Feedback Score
- 0
- Thanks
- 0
- Thanked 0 Times in 0 Posts
The ability to analyze is crucial for success in forex. With good analytical skills and understanding, traders can analyze the market accurately and profitably. I apply this approach also with Tickmill broker.
-
22-03-2023, 07:29 AM #3803Senior Investor
- Join Date
- Jun 2012
- Posts
- 3,492
- Feedback Score
- 0
- Thanks
- 0
- Thanked 9 Times in 9 Posts
WTI, H4 | POTENTIAL REVERSAL?
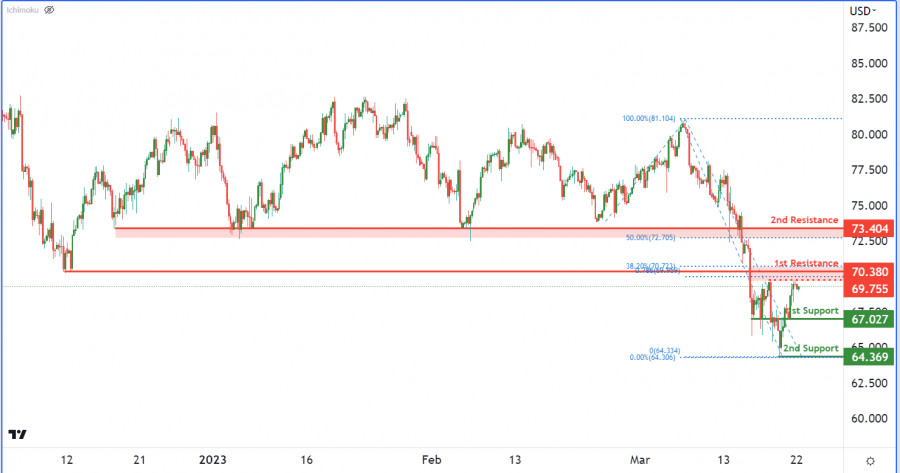
WTI crude oil has been experiencing bearish momentum lately, potentially leading to a bearish reaction off the first resistance at 70.38 and a drop towards the first support at 67.02. The second support level at 64.36 is also expected to act as support due to its multi-swing low status. The first resistance level at 70.38 is an overlap resistance, with the second resistance level at 73.40 being a 50% Fibonacci retracement level. There is also an intermediate resistance level at 69.75. Overall, the chart's momentum is bearish
Analysis are provided by InstaForex.
Read More
-
23-03-2023, 11:03 AM #3804Senior Investor
- Join Date
- Jun 2012
- Posts
- 3,492
- Feedback Score
- 0
- Thanks
- 0
- Thanked 9 Times in 9 Posts
INDICATOR ANALYSIS: DAILY REVIEW OF GBP/USD ON MARCH 23, 2023
Trend analysis (Fig. 1).
The pound-dollar pair may move upward from the level of 1.2265 (closing of yesterday's daily candle) to the target at 1.2352, the 85.4% pullback level (blue dotted line). When testing this level, the price may continue to move upward with the target at 1.2446, the upper fractal (blue dotted line).
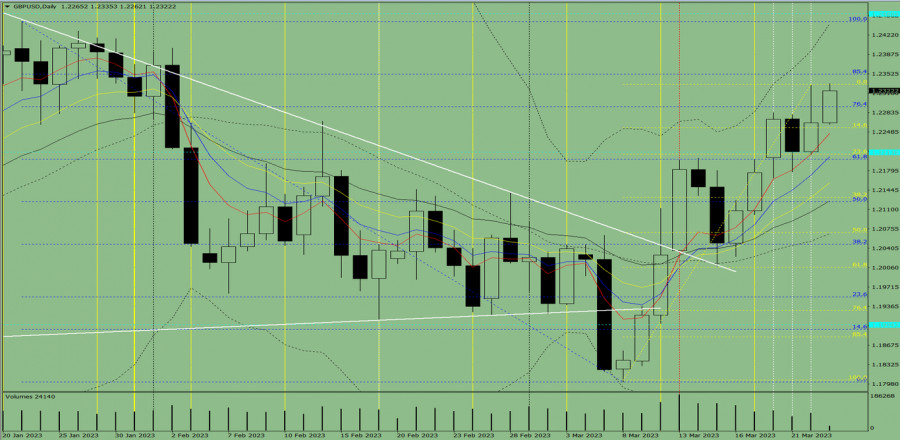
Fig. 1 (daily chart).
Comprehensive analysis:
Indicator analysis - up;
Fibonacci levels - up;
Volumes - up;
Candlestick analysis - up;
Trend analysis - up;
Bollinger bands - up;
Weekly chart - up.
General conclusion:
Today, the price may move upward from the level of 1.2265 (closing of yesterday's daily candle) to the target at 1.2352, the 85.4% pullback level (blue dotted line). When testing this level, the price may continue to move upward with the target at 1.2446, the upper fractal (blue dotted line).
Alternatively, the price may move upward from the level of 1.2265 (closing of yesterday's daily candle) to the target at 1.2352, the 85.4% pullback level (blue dotted line). From this level, a downward movement is possible with the target at 1.2256, the 14.6% pullback level (yellow dotted line).
Analysis are provided by InstaForex.
Read More
-
24-03-2023, 07:18 AM #3805Senior Investor
- Join Date
- Jun 2012
- Posts
- 3,492
- Feedback Score
- 0
- Thanks
- 0
- Thanked 9 Times in 9 Posts
BTCUSD, H4 | POTENTIAL REVERSAL FROM A KEY LEVEL ?
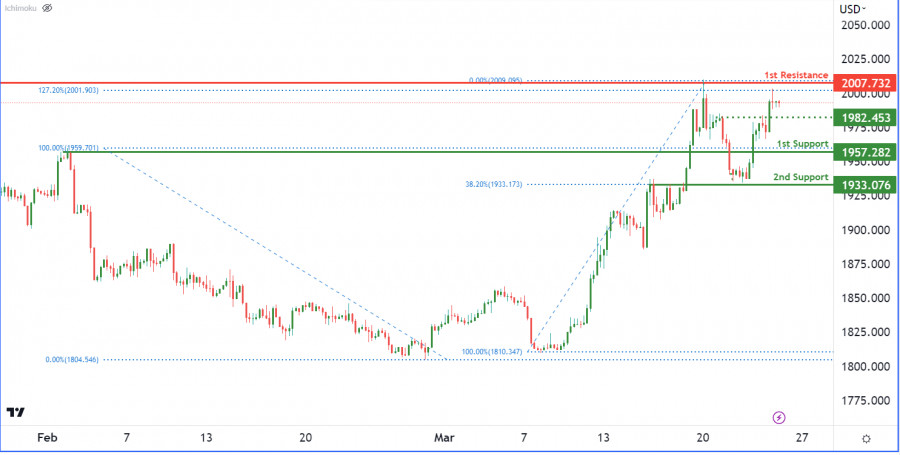
The BTC/USD chart is currently bearish, indicating potential further price drops. The first resistance level at 28342 could prompt a bearish reaction towards the first support level at 26557. This support level is an overlap support with a 23.60% Fibonacci retracement, which could be a strong buying interest area. If broken, the price could fall towards the second support level at 25204, which is also an overlap support with a 38.20% Fibonacci retracement.
On the resistance side, the first resistance level at 28342 is a multi-swing high resistance that could lead to significant selling pressure. Breaking through it may drive the price towards the second resistance level at 31662, a swing high resistance.
Analysis are provided by InstaForex.
Read More
-
27-03-2023, 08:47 AM #3806Senior Investor
- Join Date
- Jun 2012
- Posts
- 3,492
- Feedback Score
- 0
- Thanks
- 0
- Thanked 9 Times in 9 Posts
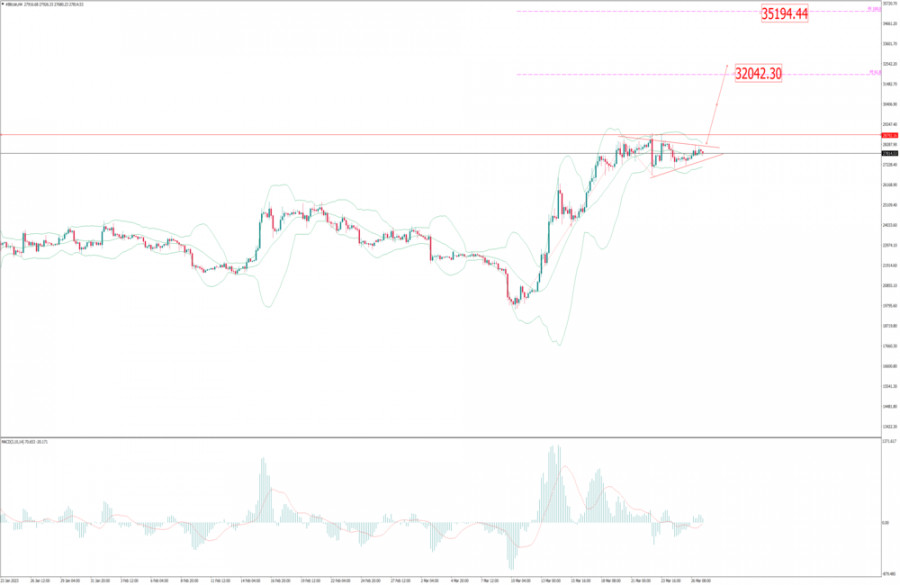
BTC UPDATE FOR MARCH 27,.2023 - TIGHT RANGE AND POTENTIAL FOR THE BREAKOUT
[IMGhttps://forex-images.ifxdb.com/userfiles/20230327/analytics6421436fa91fc.jpg[/IMG]
BTC/USD has been trading sideways at the price of $27.800 and I see potetnial for the breakout mode.
Due to the strong upside cycle in the background and higher lows on H4, I see potential for the upside continuation.
In case of the breakout of resistance at $28.500, I see potential rally towards $32.000 and $35.000
Additionally, I found contraction of Bolinger Bands, which is another confirmation of the potential breakout regime.
Analysis are provided by InstaForex.
Read More
-
27-03-2023, 08:48 AM #3807Senior Investor
- Join Date
- Jun 2012
- Posts
- 3,492
- Feedback Score
- 0
- Thanks
- 0
- Thanked 9 Times in 9 Posts
BTC UPDATE FOR MARCH 27,.2023 - TIGHT RANGE AND POTENTIAL FOR THE BREAKOUT
BTC/USD has been trading sideways at the price of $27.800 and I see potetnial for the breakout mode.
Due to the strong upside cycle in the background and higher lows on H4, I see potential for the upside continuation.
In case of the breakout of resistance at $28.500, I see potential rally towards $32.000 and $35.000
Additionally, I found contraction of Bolinger Bands, which is another confirmation of the potential breakout regime.
Analysis are provided by InstaForex.
Read More
-
28-03-2023, 02:07 AM #3808Senior Investor
- Join Date
- Jun 2012
- Posts
- 3,492
- Feedback Score
- 0
- Thanks
- 0
- Thanked 9 Times in 9 Posts
TECHNICAL ANALYSIS OF GBP/USD FOR MARCH 28, 2023
[IMGhttps://forex-images.ifxdb.com/userfiles/20230328/analytics64221dd6d76c8.jpg[/IMG]
Overview :
The GBP/USD pair traded higher and closed the day in the positive territory near the price of 1.2208. Right now, it was trading in a narrow range of 1.2150 staying close to a 2-days high. On the hourly chart, the GBP/USD pair is still trading above the MA (100) H1 moving average line (1.2068 - weekly pivot point). The situation is similar on the 4-hour chart. Based on the foregoing, it is probably worth sticking to the north direction in trading, and as long as the GBP/USD pair remains above MA 100 H1, it may be necessary to look for entry points to buy for the formation of a correction.
All elements being clearly bullish, it would be possible for traders to trade only long positions on the GBP/USD pair as long as the price remains well above the golden ratio of 1.2068. The buyers' bullish objective is set at 1.2209.
The price is likely to form a double top in the same time frame. Accordingly, the GBP/USD pair is showing signs of strength following a breakout of the highest level of 1.2209. So, buy above the level of 1.2068 with the first target at 1.2209 in order to test the daily resistance 1.
The level of 1.2209 is a good place to take profits. Moreover, the RSI is still signaling that the trend is upward as it remains strong above the moving average (100). This suggests that the pair will probably go up in coming hours.
A bullish break in this resistance would boost the bullish momentum. Other outlook for the GBP/USD pair : Pound Sterling is currently trading at 1.2150. If the trend reverses from this point, then a possible future share price target could be 1.2209.
If the price of Pound Sterling is trading above 1.2150 then possibility of upside targets getting achieved is higher around the level of 1.2150.
The basic bullish trend is very strong on the GBP/USD pair, but the short term shows some signs of running out of steam. Nevertheless, a purchase could be considered as long as the price remains above 1.2150. Crossing the first resistance at 1.2209 would be a sign of a potential new surge in the price.
Buyers would then use the next resistance located at 1.2270 as an objective. Crossing it would then enable buyers to target 1.2270. Caution, a return to below 1.2270 would be a sign of a consolidation phase in the short-term basic trend.
If this is the case, remember that trading against the trend may be riskier. It would seem more appropriate to wait for a signal indicating reversal of the trend.
In the very short term, the general bullish sentiment is not called into question, despite technical indicators being indecisive.
All elements being clearly bullish market, it would be possible for traders to trade only long positions on the GBP/USD pair as long as the price remains well above the price of 1.2068.
The GBP/USD pair will continue rising from the level of 1.2068 in the long term. It should be noted that the support is established at the level of 1.2068 which represents the last bearish wave. The price is likely to form a double bottom in the same time frame.
Accordingly, the GBP/USD pair is showing signs of strength following a breakout of the highest level of 1.2068. So, buy above the level of 1.2068 with the first target at 1.2209 in order to test the daily resistance 1.
The buyers' bullish objective is set at the level of 1.2270 (last bullish wave). A bullish break in this resistance would boost the bullish momentum.
The buyers could then target the resistance located at 1.2270 . This suggests that the pair will probably go up in coming hours.
If the trend is able to break the level of 1.2209 (double top), then the market will call for a strong bullish market towards the objective of 1.2270 this week. If there is any crossing, the next objective would be the resistance located at 1.2270.
The level of 1.2270 is a good place to take profits. Moreover, the RSI is still signaling that the trend is upward as it remains strong above the moving average (100).
Since the trend is above the 61.8% Fibonacci level (1.2068), it means the market is still in a uptrend. From this point, the GBP/USD pair is continuing in a bullish trend from the new support of 1.2068. This is shown to us as the current price is in a bullish channel.
According to the previous events, we expect that the GBP/USD pair will move between 1.2068 and 1.2270 in coming hours. It is also should be noted, beware of bullish excesses that could lead to a possible short-term correction; but this possible correction would not be tradeable.
On the other hand, in case a reversal takes place and the GBP/USD pair breaks through the support level of 1.2068, a further decline to 1.1981 can occur. It would indicate a bearish market.
Analysis are provided by InstaForex.
Read More
-
29-03-2023, 03:34 AM #3809Senior Investor

- Join Date
- Jul 2011
- Location
- www.ArmadaMarkets.com
- Posts
- 4,135
- Feedback Score
- 0
- Thanks
- 0
- Thanked 2 Times in 2 Posts
That's very useful information, as I myself am still learning and practicing in analyzing the market. However, since joining Tickmill and following the education provided, I have been able to analyze the market accurately and profitably.
-
29-03-2023, 06:35 AM #3810Senior Investor
- Join Date
- Jun 2012
- Posts
- 3,492
- Feedback Score
- 0
- Thanks
- 0
- Thanked 9 Times in 9 Posts
TECHNICAL ANALYSIS OF DAILY PRICE MOVEMENT OF NATURAL GAS COMMODITY ASSET, WEDNESDAY MARCH 29 2023.
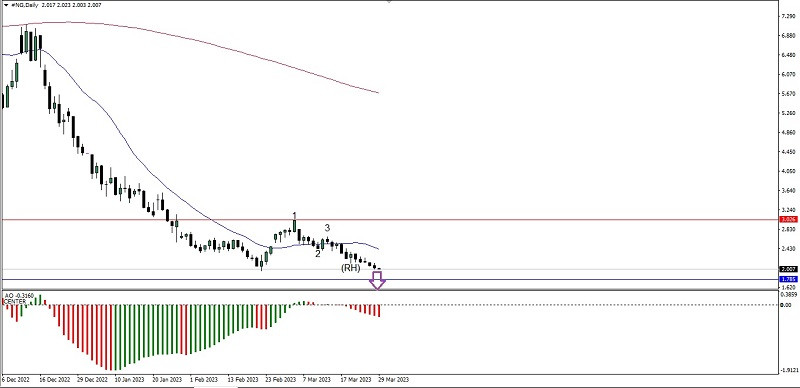
If we look on the daily chart of Natural Gas commodity asset then it will seen that both of Moving Average is on Death Cross condition as well as supported by the appearance of Bearish 123 pattern follow by Ross Hook (RH) also Awesome Oscillator indicator was on negative area so in a few days ahead, Natural Gas has the potential to depreciated down below where the level of 1,967 will try to tested to break below, as long as there is no upward correction movement which is quite significant until it breaks above the level of 2,427, Natural Gas has the potential to continue its decline to the level of 1,785.
Analysis are provided by InstaForex.
Read More
-
Sponsored Links


 Reply With Quote
Thread Information
Users Browsing this Thread
There are currently 1 users browsing this thread. (0 members and 1 guests)
 Posting Permissions
24 Hour Gold

Advertising
- Over 20.000 UNIQUE Daily!
- Get Maximum Exposure For Your Site!
- Get QUALITY Converting Traffic!
- Advertise Here Today!
Out Of Billions Of Website's Online.
Members Are Online From.
- Get Maximum Exposure For Your Site!
- Get QUALITY Converting Traffic!
- Advertise Here Today!
Out Of Billions Of Website's Online.
Members Are Online From.


