
 LinkBack URL
 About LinkBacks
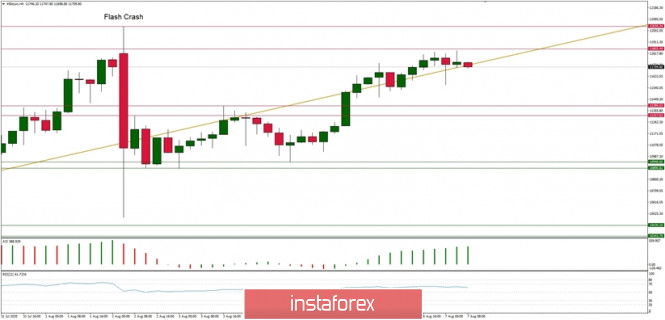
Technical Analysis of BTC/USD for August 7, 2020:
Crypto Industry News:
Someone with access to 119,756 Bitcoins stolen from the Bitfinex cryptocurrency exchange in 2016 transferred $ 12 million to unknown wallets in the last six days.
According to a series of tweets posted by Whale Alert on Twitter on August 3, wallet addresses known to be linked to one of the largest attacks in the history of cryptocurrency exchanges resulted in the transfer of 620 Bitcoins - with a current value of around $ 7 million - using 4 transactions. On July 29, nearly $ 5 million - or 448 BTC - was transferred in a single transaction. Coupled with the last move of $ 39 million from July 27-28, this is about $ 51 million in Bitcoin that was transferred in over 17 transactions during the week.
On August 2, 2016, hackers compromised Bitfinex by stealing 119,756 BTC - worth $ 72 million at the time. After four years and recent growth movements, their total value is now $ 1.3 billion.
However, despite the recent movement of $ 51 million, burglars only transferred 1-2% of stolen funds. This suggests that criminals may struggle as they enforce the new anti-money laundering (AML) laws.
Technical Market Outlook:
The BTC/USD pair keeps hovering around this year's highs and the market sentiment is clearly bullish. The price has broken out from a narrow zone located between the levels of $10,895 - $11,317 and then the local high was made at the level of $11,738 on increased momentum, so bulls are showing their strength. The next target for bulls is of course the last yearly high seen at the level of $12,035. The immediate support for the intraday traders are seen at the levels of $11,646, $11,395 and $11, 317. The volatility is now quite subdued, but it might increase again once any important technical level is tested and broken.
Weekly Pivot Points:
WR3 - $14,325
WR2 - $13,003
WR1 - $12,116
Weekly Pivot - $10,976
WS1 - $9,784
WS2 - $8,681
WS3 - $7,717
Trading Recommendations: Due to the level of $12,000 violation, the Bitcoin is now in the up trend on the long-term time frame. The next target for bulls is seen at the level of $13,712 and $15,000. The key long-term technical support is located at the level of $7,897, but the zone around $9,500 - $10,500 is an important technical support as well.
Analysis are provided byInstaForex.
Please visit our sponsors
Results 3,071 to 3,080 of 4086
Thread: InstaForex Wave Analysis
-
07-08-2020, 07:22 AM #3071Senior Investor


- Join Date
- Aug 2012
- Posts
- 1,942
- Feedback Score
- 0
- Thanks
- 0
- Thanked 0 Times in 0 Posts

-
10-08-2020, 07:42 AM #3072Senior Investor
- Join Date
- Aug 2012
- Posts
- 1,942
- Feedback Score
- 0
- Thanks
- 0
- Thanked 0 Times in 0 Posts
Technical Analysis of GBP/USD for August 10, 2020:
Technical Market Outlook:
The GBP/USD pair has been seen moving lower in the recent pull-back. The bears has hit the level of 1.3008 and then the bulls has pushed the rate back towards the level of 1.3067. This is where the Pound starts the early Monday trading and overall is still consolidating the gains despite the recent local pull-backs. The key technical support is seen at the level of 1.2979, so as long as the market trades above it, the odds for another wave up are high.
Weekly Pivot Points:
WR3 - 1.3353
WR2 - 1.3261
WR1 - 1.3146
Weekly Pivot - 1.3060
WS1 - 1.2937
WS2 - 1.2860
WS3 - 1.2735
Trading Recommendations:
On the GBP/USD pair the main trend is down, which can be confirmed by the down candles on the weekly time frame chart. The key long-term technical support is seen at the level of 1.1404. The key long-term technical resistance is seen at the level of 1.3518. Only if one of these levels is clearly violated, the main trend might reverse (1.3518) or accelerate (1.1404).
Analysis are provided byInstaForex.
-
11-08-2020, 06:59 AM #3073Senior Investor
- Join Date
- Aug 2012
- Posts
- 1,942
- Feedback Score
- 0
- Thanks
- 0
- Thanked 0 Times in 0 Posts
Forecast for EUR/USD on August 11, 2020
EUR/USD
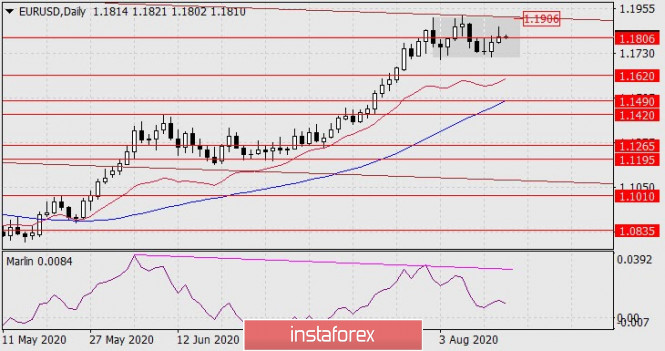
The euro is slowly moving towards its target at 1.1620 (high on October 16, 2018). The Marlin oscillator is declining, remaining in the positive trend zone. As the price moves below the target level of 1.1620, Marlin will obviously already be in a negative, that is, a downward trend. As a result, we are waiting for the new downward movement to strengthen in a new emerging trend. After the price leaves the area below 1.1620, the second target at 1.1490 will open, where the price can meet the MACD line.
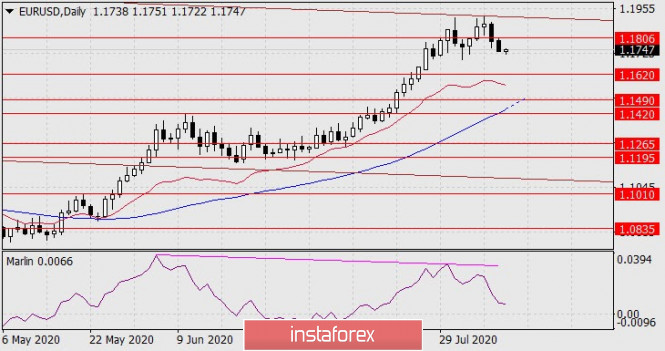
The decline is taking its course on the four-hour chart; the price is below the balance indicator lines (the balance has strengthened in a downward direction), the MACD line is moving down, that is, the medium-term trend has changed to a downward one. Marlin is also slowly deepening into the zone of negative values, into the zone of the bears' possession.
Analysis are provided byInstaForex.
-
12-08-2020, 07:23 AM #3074Senior Investor
- Join Date
- Aug 2012
- Posts
- 1,942
- Feedback Score
- 0
- Thanks
- 0
- Thanked 0 Times in 0 Posts
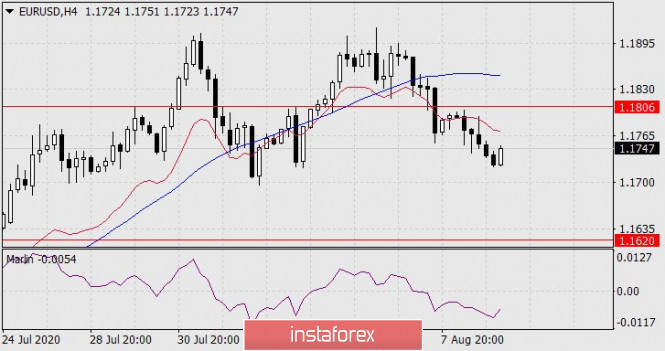
Forecast for EUR/USD on August 12, 2020
EUR/USD
The euro and other counterdollar currencies rallied during the first half of Tuesday, on what appears to be profit taking in the first short sales since Friday. The ZEW economic sentiment index in Germany jumped from 59.3 to 71.5 in August against expectations of 58.0 points. The index was higher only in February 2004 (72.9). But this indicator, and especially at this time, has a strong psychological component; it is compiled on the basis of surveys of business representatives who, as always, expect an improvement in their prospects. This was confirmed by the index of current economic conditions ZEW, which showed a drop in the index from -80.9 to -81.3, and against the forecast of growth to -68.8.
The dollar went on the offensive in the afternoon and as a result the euro closed the day at the opening price. The situation has not changed for the euro on the technical side, the price is heading towards its 1.1620 target. The Marlin oscillator is even closer to the border of the negative trend territory. Its introduction will ease the euro's fall.
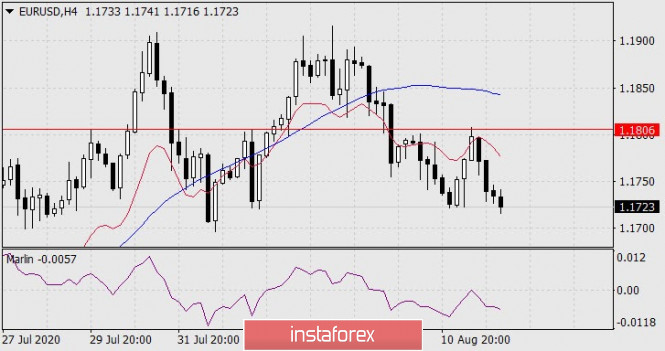
Yesterday's growth stopped by the target level of 1.1806 on the four-hour chart. The level has confirmed its strength, now the price can have no doubts about choosing a direction. The first target is 1.1620.
Analysis are provided byInstaForex.
-
13-08-2020, 07:26 AM #3075Senior Investor
- Join Date
- Aug 2012
- Posts
- 1,942
- Feedback Score
- 0
- Thanks
- 0
- Thanked 0 Times in 0 Posts
Control zones for EURUSD on 08/13/20
We are testing the WCZ 1/2 1.1811-1.1802 today, which is a defining moment when building a trading plan. If today's trade closes below the zone, then sales of the instrument will come to the fore, and the first target of the fall will be the current week's low.
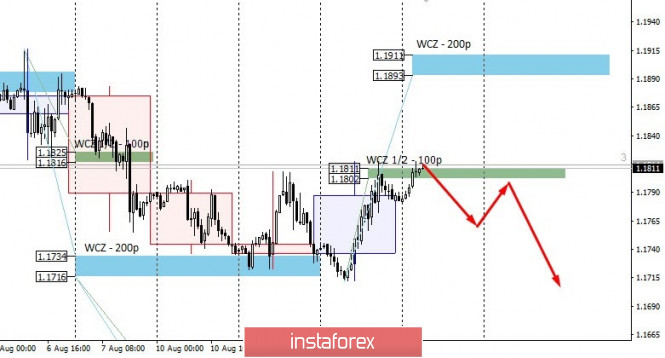
Working in a downward direction will make it possible for us to continue forming a downward compensatory pattern, the goal of which is to return to the monthly control zone in July.
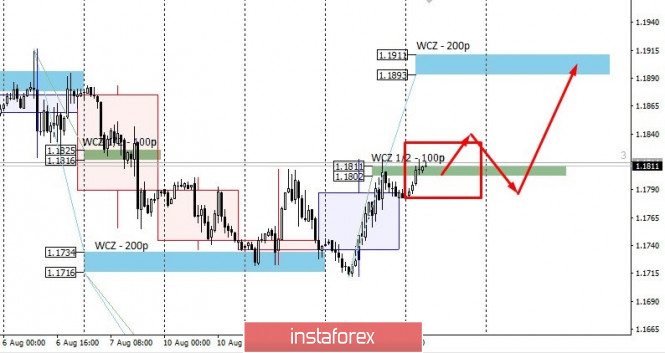
If today's trade closes above the WCZ 1/2, it will enable us to look for purchases at tomorrow's European session. The growth target will be the weekly CZ 1.1911-1.1893. Working in an upward direction will not violate the accumulation zone that has already formed. The main growth boundary is still the monthly high.
.Daily CZ - daily control zone. The area formed by important data from the futures market, which changes several times a year.
Weekly CZ - weekly control zone. The zone formed by important marks of the futures market, which changes several times a year.
Monthly CZ - monthly control zone. The zone, which is a reflection of the average volatility over the past year.
Analysis are provided byInstaForex.
-
14-08-2020, 07:31 AM #3076Senior Investor
- Join Date
- Aug 2012
- Posts
- 1,942
- Feedback Score
- 0
- Thanks
- 0
- Thanked 0 Times in 0 Posts
Forecast for EUR/USD on August 14, 2020
EUR/USD
The euro's 28 points gain from yesterday plunged into a wide range of uncertainty and wandered through 1.1710-1.1906. The Marlin oscillator is directed downwards on the daily chart, and the price is exactly at the 1.1806 target level. The price could reach the upper border of the price channel at 1.1906 without a critical upward reversal of the oscillator. The price may even cross this border and a double divergence will not form according to the oscillator, which creates increased uncertainty for the currency pair.
For a medium-term downward movement, it is no longer enough for the price to gain a foothold below the 1.1806 level, it should consolidate below the lower border of the 1.1710 range.
The situation is no less uncertain on the four-hour chart. The Marlin oscillator is in the growth zone, the price is above the balance line, but below the MACD line.
Trading the euro today and even on Monday is associated with increased risk.
Analysis are provided byInstaForex.
-
17-08-2020, 07:18 AM #3077Senior Investor
- Join Date
- Aug 2012
- Posts
- 1,942
- Feedback Score
- 0
- Thanks
- 0
- Thanked 0 Times in 0 Posts
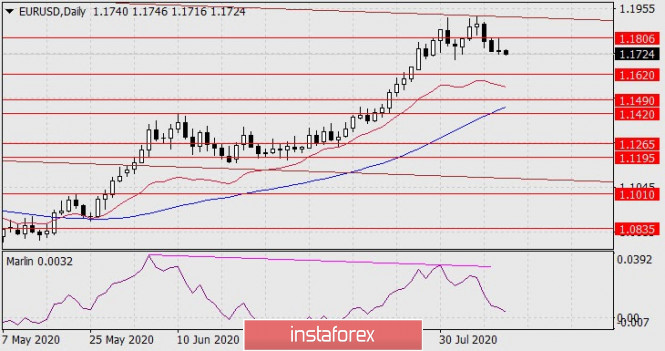
Forecast for EUR/USD on August 17, 2020
EUR/USD The euro continued to develop in the uncertain range of 1.1712-1.1903 on Friday. The euro will continue to increase if the price goes above the upper limit of the price channel at 1.1903, and in this case, the target range will be 1.2040/55. Historically, the range corresponds to the low of July 2012. The price reaching the specified range can also mean that a double diverenge on the Marlin oscillator can form. That is, the euro growing by two figures will not cancel the main scenario of a currency reversal in the medium and long term.
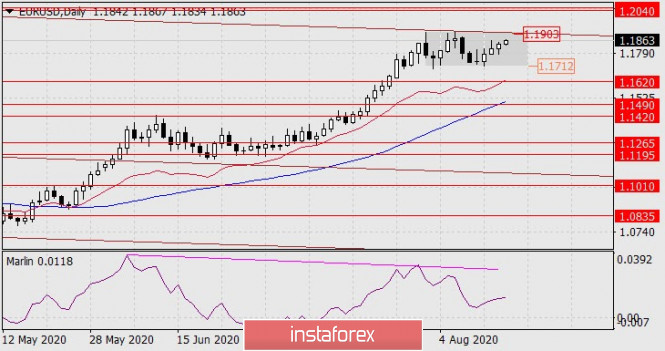
The price falling below the lower border of the range will mean that it is out of the free roaming zone and the first target will be the level of 1.1620, then 1.1490. The price divergence with the Marlin oscillator will increase, the signal line will enter the zone of negative values, and this will lead to an accelerated fall in the euro.
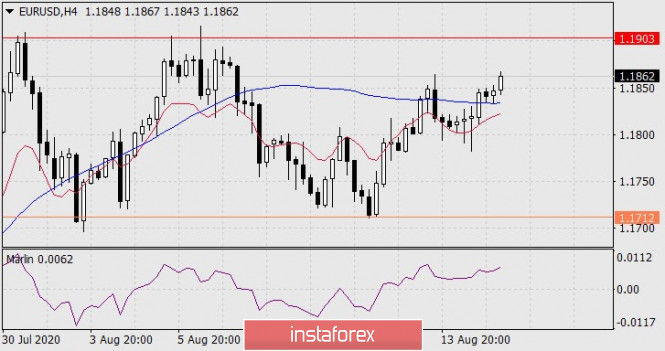
The price consolidated above the MACD indicator line on the four-hour chart, Marlin is also in the growth zone, which together maintains an increased probability of growth to 1.1903. Nevertheless, since the price is in the free roaming zone, it can once again go under this line, as it was on August 13-14. We are waiting for the development of events.
Analysis are provided byInstaForex.
-
18-08-2020, 07:36 AM #3078Senior Investor
- Join Date
- Aug 2012
- Posts
- 1,942
- Feedback Score
- 0
- Thanks
- 0
- Thanked 0 Times in 0 Posts
Forecast for USD/JPY on August 18, 2020
USD/JPY
The Japanese yen sharply accelerated the pace of its strengthening (decline on the chart) after breaking the MACD line on a daily chart. There are about 20 points left to the nearest goal along the 105.45 price channel. The signal line of the Marlin oscillator has entered the negative trend zone, which creates the risk of continuing to pull down the price to the second target of 104.60.
The price has consolidated below the MACD indicator line on the four-hour chart, which also increases the likelihood of overcoming the 105.45 level. But the Marlin oscillator is already entering the oversold zone, which may be a signal for a reversal from the first target level of 105.45.
So: if the price settles below the 105.45 level, we are waiting for the price to fall to the second target of 104.60, consolidating the price above 106.12 will mean restoring growth to 106.70 with a repeated attempt to overcome 107.00.
Analysis are provided byInstaForex.
-
19-08-2020, 07:40 AM #3079Senior Investor
- Join Date
- Aug 2012
- Posts
- 1,942
- Feedback Score
- 0
- Thanks
- 0
- Thanked 0 Times in 0 Posts
Analysis and trading recommendations for the EUR/USD pair on August
Trading recommendations for EUR / USD on August 19 Analysis of transactions Bulls were active at the level of 1.1895 yesterday, as a result of which the quote reached the target level of 1.1933. Such brought profit of about 35 pips within the day.
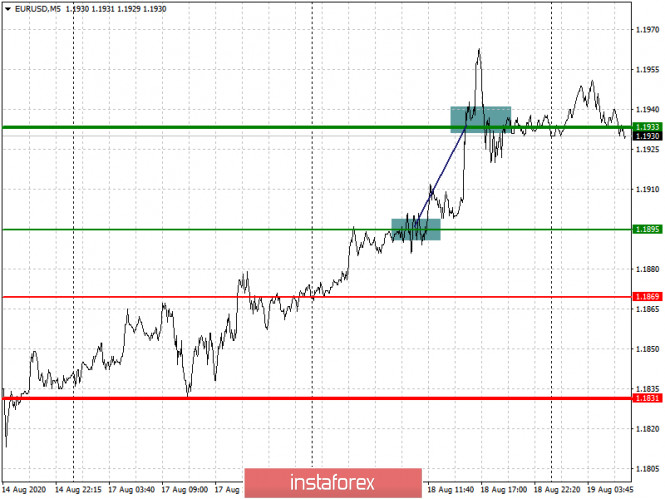
This sharp rise in the euro came after US Treasury Secretary Steven Mnuchin said that there was no expected progress in the negotiations between Republicans and Democrats with regards to a new stimulus package.
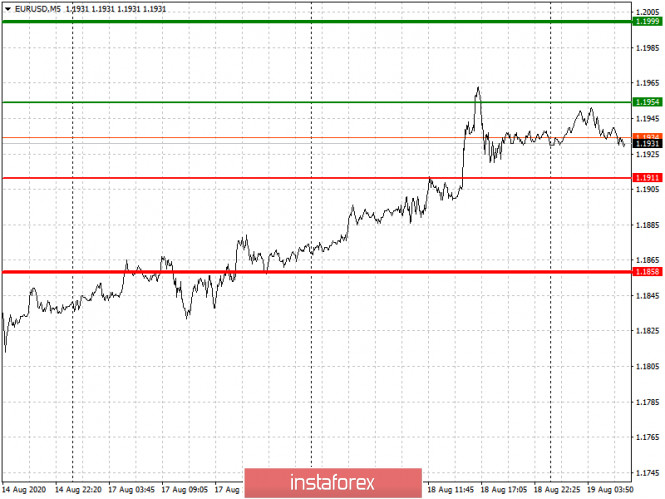
Set up buy deals when the quote reaches the price level of 1.1954 (green line on the chart), targeting a rise towards the level of 1.1999. The increase may occur, on the grounds of good inflation data in the eurozone. Take profit at the level of 1.1999. Meanwhile, sell positions after the quote hits a price level of 1.1911 (red line on the chart), aiming a drop to a price of 1.1858. However, such a scenario has a low chance of occurring since aside from inflation data, the latest Fed protocol will also be published today, the contents of which is forecast to put additional pressure on the US dollar. Nonetheless, take profit at the level of 1.1858.
Analysis are provided byInstaForex.
-
20-08-2020, 07:31 AM #3080Senior Investor
- Join Date
- Aug 2012
- Posts
- 1,942
- Feedback Score
- 0
- Thanks
- 0
- Thanked 0 Times in 0 Posts
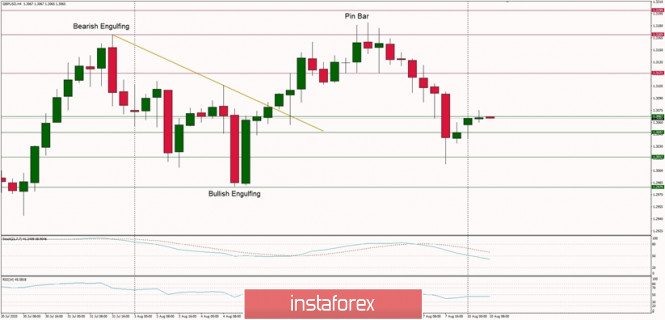
Forecast for GBP/USD on August 20, 2020
GBP/USD After the British pound gained 135 points on Wednesday and Thursday, this growth was offset by a fall of 140 points. This figure of two extreme candlesticks is called the pattern of rails, a reversal pattern. Also, the Marlin Oscillator formed a divergence with the price.
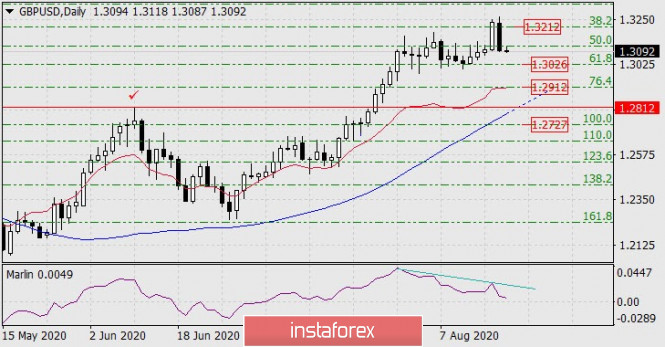
The closest target for the pound is the 61.8% Fibonacci level at 1.3026, where the British currency has already found support in the period from August 3 to 13. That is, the level is strong enough, and breaking it will send the price to the second target of 1.2912 (76.4% Fibonacci). The main struggle will unfold on the daily MACD line in the 1.2812 area, which is also the price peak from June 10. Overcoming this level reveals the scenario of a medium-term fall of the British currency.
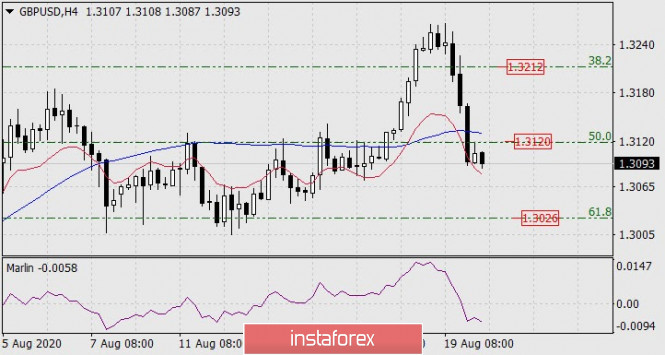
The price settled below the Fibonacci level of 50.0% on the four-hour chart and below the MACD indicator line, which clears the way for the price to 1.3026.
Analysis are provided byInstaForex.
-
Sponsored Links


 Reply With Quote
Thread Information
Users Browsing this Thread
There are currently 1 users browsing this thread. (0 members and 1 guests)
 Posting Permissions
24 Hour Gold

Advertising
- Over 20.000 UNIQUE Daily!
- Get Maximum Exposure For Your Site!
- Get QUALITY Converting Traffic!
- Advertise Here Today!
Out Of Billions Of Website's Online.
Members Are Online From.
- Get Maximum Exposure For Your Site!
- Get QUALITY Converting Traffic!
- Advertise Here Today!
Out Of Billions Of Website's Online.
Members Are Online From.


