
 LinkBack URL
 About LinkBacks
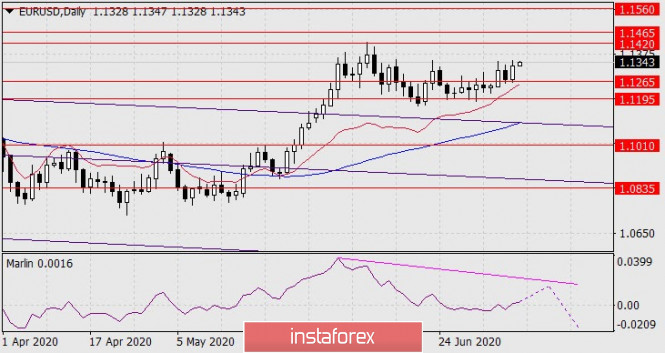
Forecast for EUR/USD on July 9, 2020
EUR/USD The euro confirmed its intention to form a new local high yesterday, above June 10 at 1.1420, and thereby form a divergence with the Marlin oscillator. The signal line of this indicator entered the positive trend zone. We are waiting for the price in the target range of 1.1420/65. Overcoming it can raise the price even higher, to the target level of 1.1560.
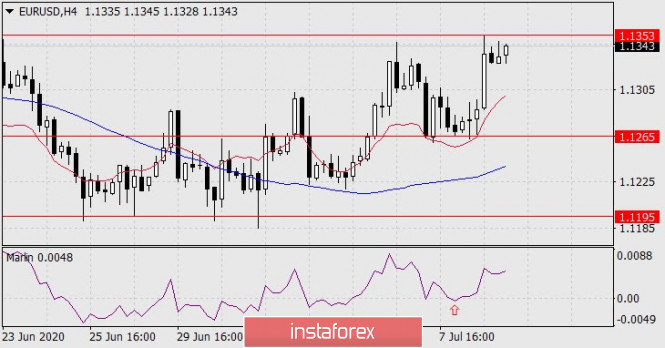
The price is gathering new strength before taking the intermediate level of 1.1353 on the four-hour chart. The Marlin oscillator turned around from the border with the territory of the bears, the growth of Marlin is strong, the price is higher than the balance and MACD indicator lines. Most likely the resistance will be overcome.
Analysis are provided byInstaForex.
Please visit our sponsors
Results 3,051 to 3,060 of 4086
Thread: InstaForex Wave Analysis
-
09-07-2020, 07:22 AM #3051Senior Investor


- Join Date
- Aug 2012
- Posts
- 1,942
- Feedback Score
- 0
- Thanks
- 0
- Thanked 0 Times in 0 Posts

-
10-07-2020, 07:20 AM #3052Senior Investor
- Join Date
- Aug 2012
- Posts
- 1,942
- Feedback Score
- 0
- Thanks
- 0
- Thanked 0 Times in 0 Posts
USD/JPY price movement for July 10, 2020.
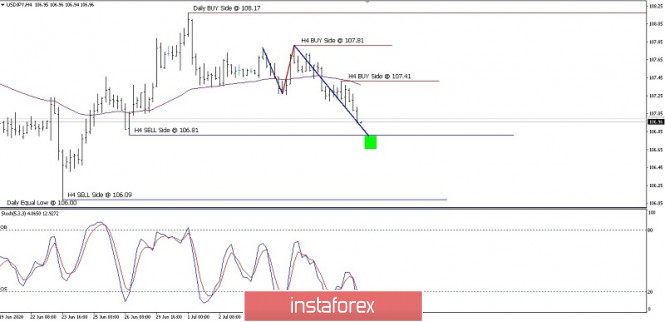
On the 4-hour chart, the USD/ JPY pair is now trying to reach the 106.81 level as its first target. If the bullish momentum is strong enough, there is a possiblility that USD/JPY will continue its downward movement and reach the 106.09 level too as its second target. This scenario is likely to occur as long as this pair does not rise and close above the 107.41 level.
Analysis are provided byInstaForex.
-
13-07-2020, 07:12 AM #3053Senior Investor
- Join Date
- Aug 2012
- Posts
- 1,942
- Feedback Score
- 0
- Thanks
- 0
- Thanked 0 Times in 0 Posts
Forecast for EUR/USD on July 13, 2020
EUR/USD
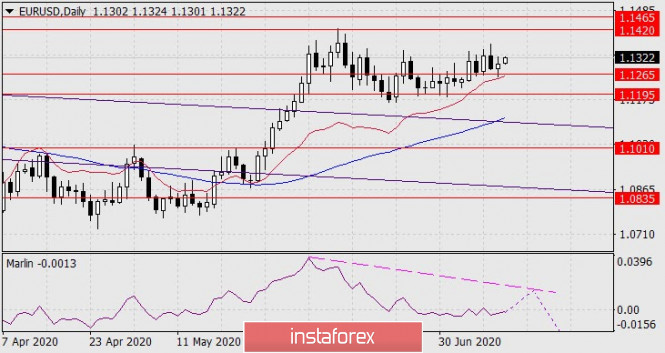
The euro closed Friday with growth. The price found strong support at 1.1265. The growth continues this morning, the Marlin oscillator is in a hurry to move to the growth zone – in the upper half of its own window. The divergence option, in which the euro will show a new high (1.1465), is gaining more and more strength.
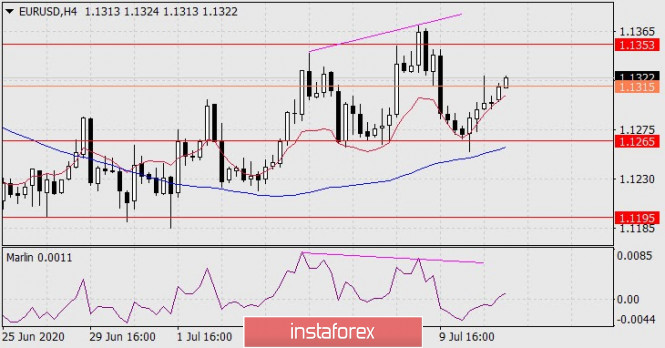
The price overcomes the signal level of 1.1315 on the four-hour chart, the Marlin oscillator moved to the growing trend zone, and the nearest growth target is the level of 1.1353. Overcoming the level opens the way to 1.1420, then to 1.1465. The recently formed divergence is considered fulfilled, the price has taken a course for a new short-term trend.
Analysis are provided byInstaForex.
-
14-07-2020, 06:15 AM #3054Senior Investor
- Join Date
- Aug 2012
- Posts
- 1,942
- Feedback Score
- 0
- Thanks
- 0
- Thanked 0 Times in 0 Posts
Forecast for EUR/USD on July 14, 2020
EUR/USD
The euro showed the expected growth on Monday, but the structure of this growth was tricky, there was a potential for the price to turn down, in a deep correction, for example, to the target level of 1.1195. This warning signal is weak on the daily chart. This is the probability of a reversal of the signal line of the Marlin oscillator from the border of the growth territory. Consolidating the price above yesterday's high will continue to develop in the market according to the main scenario – the euro's growth in the target range of 1.1420/65 with a divergence forming on Marlin.
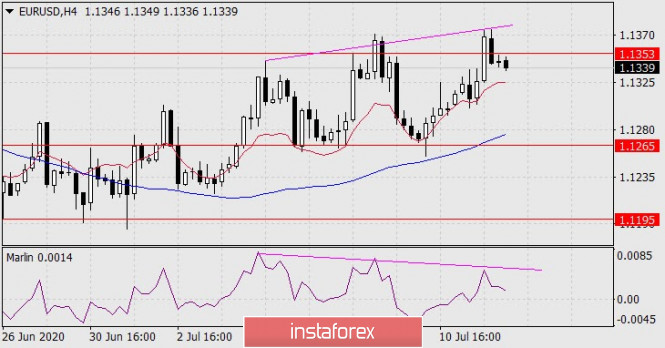
The risk of a downward price reversal is stronger on the four-hour chart - this is a double divergence on the Marlin oscillator. Leaving the price below 1.1265 opens the remaining path to 1.1195. After falling below this level, the price will face a difficult task of reaching the target level of 1.1010 – it will face both difficult supports and weak dynamics on the discharged oscillators.
Analysis are provided byInstaForex.
-
15-07-2020, 09:15 AM #3055Senior Member

- Join Date
- Feb 2013
- Posts
- 212
- Feedback Score
- 0
- Thanks
- 0
- Thanked 0 Times in 0 Posts
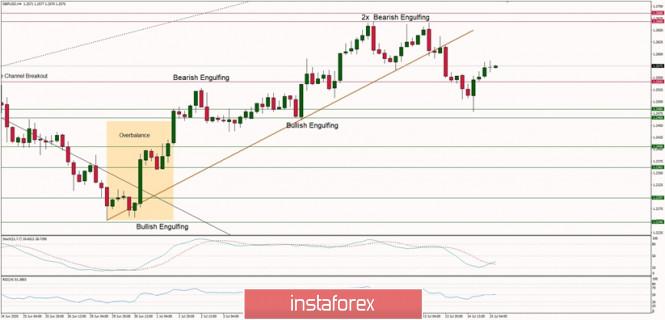
Technical Analysis of GBP/USD for July 15, 2020:
Technical Market Outlook:
After the GBP/USD pair had made a Double Top price pattern at the level of 1.2668, the bears have managed to push the prices towards the level of 1.2484 which is the key short-term technical support for the market. The price has bounced from support, but no new high was made yet ( the local high was made at the level of 1.2586. The bulls might try to test the trend line from below, but this move would require more momentum in order to get to the level of 1.2640. The RSI indicator shows the momentum is neutral, so neither bulls not bears are in control of the market (on the short-term time frame like H4). Any violation of the level of 1.2466 will accelerate the sell-off towards the next technical support seen at the level of 1.2406.
Weekly Pivot Points:WR3 - 1.2915WR2 - 1.2796WR1 - 1.2712Weekly Pivot - 1.2585WS1 - 1.2508WS2 - 1.2378
WS3 - 1.2304
Trading Recommendations:
On the GBP/USD pair the main trend is down, which can be confirmed by the down candles on the weekly time frame chart. The key long-term technical support has been recently violated (1.1983) and the new one is seen at the level of 1.1404. The key long-term technical resistance is seen at the level of 1.3518. Only if one of these levels is clearly violated, the main trend might reverse (1.3518) or accelerate (1.1404). The market might have done a Double Top pattern at the level of 1.2645, so the price might move even lower in the longer-term. *The market analysis posted here is meant to increase your awareness, but not to give instructions to make a trade.
*The market analysis posted here is meant to increase your awareness, but not to give instructions to make a trade.
-
16-07-2020, 07:10 AM #3056Senior Investor
- Join Date
- Aug 2012
- Posts
- 1,942
- Feedback Score
- 0
- Thanks
- 0
- Thanked 0 Times in 0 Posts
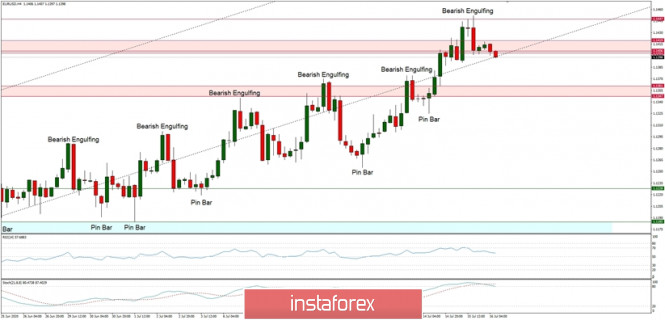
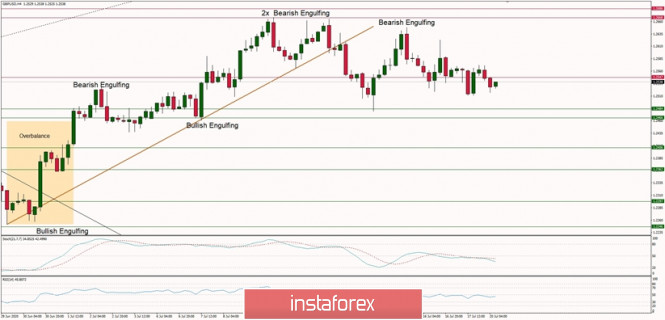
Technical Analysis of EUR/USD for July 16, 2020:
Technical Market Outlook:
Another Bearish Engulfing candlestick pattern has been made at the top of the last move up at the level of 1.1452, but bulls are not giving up. This is the seventh attempt to rally above the supply zone located between the levels of 1.1406 - 1.1419. The RSI indicator shows the positive and strong momentum, so the market participants should wait for a Pin Bar like candlestick around the level of 1.1400. If there is this kind of a reversal candlestick pattern, then the bulls might continue the local up trend towards the level of 1.1497.
Weekly Pivot Points:
WR3 - 1.1497
WR2 - 1.1428
WR1 - 1.1365
Weekly Pivot - 1.1301
WS1 - 1.1233
WS2 - 1.1170
WS3 - 1.1101
Trading Recommendations:
On the EUR/USD pair, the main long-term trend is down, but the local up trend continues. The key long-term technical support is seen at the level of 1.0336 and the key long-term technical resistance is seen at the level of 1.1540. Only if one of this levels is clearly violated, the main trend might reverse (1.1540) or accelerate (1.0336).
Analysis are provided byInstaForex.
-
17-07-2020, 07:07 AM #3057Senior Investor
- Join Date
- Aug 2012
- Posts
- 1,942
- Feedback Score
- 0
- Thanks
- 0
- Thanked 0 Times in 0 Posts
Control zones for AUDUSD on 07/17/20
Previously opened purchases must be kept. The first goal for growth is to renew weekly and monthly highs. It is important to understand that a reversal model will only form in case closing of trades occur below the WCZ 1/2 0.6949-0.6940. Until this happens, buying is the best strategy. Yesterday's decline made it possible for us to get favorable prices to open a long position.
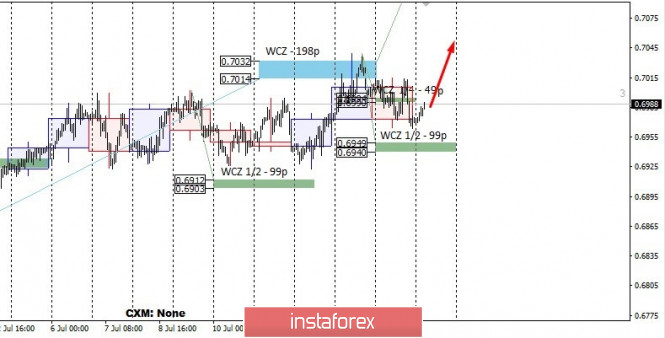
Closing today's trading above the week's local high will make it possible for us to talk about growth lasting until next week.
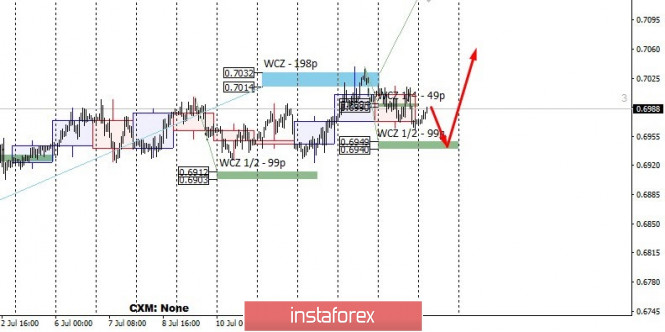
Testing the WCZ 1/2 0.6949-0.6940 will be required to obtain more favorable prices for purchasing the instrument. If this happens, then the entrance will require any absorption pattern to form on a time frame of at least m30. It is necessary to close today's trading below the WCZ 1/2 to break the upward pattern. This will allow you to exit all long positions and consider sales on Monday.
Daily CZ - daily control zone. The area formed by important data from the futures market, which changes several times a year.
Weekly CZ - weekly control zone. The zone formed by important marks of the futures market, which changes several times a year.
Monthly CZ - monthly control zone. The zone, which is a reflection of the average volatility over the past year.
Analysis are provided byInstaForex.
-
20-07-2020, 07:22 AM #3058Senior Investor
- Join Date
- Aug 2012
- Posts
- 1,942
- Feedback Score
- 0
- Thanks
- 0
- Thanked 0 Times in 0 Posts
Technical Analysis of GBP/USD for July 20, 2020:
Technical Market Outlook:
The GBP/USD pair has been seen trading inside of the narrow consolidation zone located between the levels of 1.2482 - 1.2668 for all the last week and nothing has changed yet. The volatility has decreased and the momentum is hovering around the level of fifty, so no clues from this indicator either. Only a sustained breakout above of below certain level can provide a clue regarding the next market move.
Weekly Pivot Points:
WR3 - 1.2834
WR2 - 1.2735
WR1 - 1.2648
Weekly Pivot - 1.2555
WS1 - 1.2463
WS2 - 1.2373
WS3 - 1.2271
Trading Recommendations:
On the GBP/USD pair the main trend is down, which can be confirmed by the down candles on the weekly time frame chart. The key long-term technical support has been recently violated (1.1983) and the new one is seen at the level of 1.1404. The key long-term technical resistance is seen at the level of 1.3518. Only if one of these levels is clearly violated, the main trend might reverse (1.3518) or accelerate (1.1404). The market might have done a Double Top pattern at the level of 1.2645, so the price might move even lower in the longer-term.
Analysis are provided byInstaForex.
-
21-07-2020, 07:19 AM #3059Senior Investor
- Join Date
- Aug 2012
- Posts
- 1,942
- Feedback Score
- 0
- Thanks
- 0
- Thanked 0 Times in 0 Posts
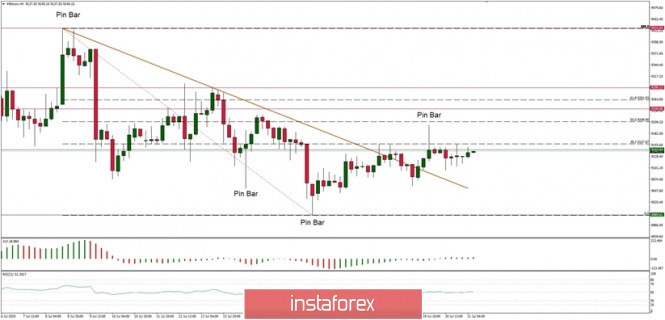
Technical Analysis of BTC/USD for July 21, 2020:
Crypto Industry News:
The underground of the Internet, or darknet, is that part of the web that is beyond the reach of traditional browsers and search engines. There are tons of digital markets in this network where all kinds of illegal goods are traded and paid for with cryptocurrencies.
In a State of Crypto Crimes report released earlier this year, blockchain analyst Chainalysis investigated crimes committed using cryptography, among them darknet transactions, which were the most consistent. In 2019, revenues from online underground markets hit a new record of $ 790 million.
While indicators on all financial fronts for these markets are rising, one aspect that remains much more consistent is the choice of cryptocurrency.
"The most popular cryptocurrency used by the darknet is Bitcoin," said Kim Grauer, head of research, and Carles Lopez-Penalver, senior cybercrime analyst at Chainlysis.
Among the altcoins used are Litecoin, Bitcoin Cash, and Monero. Even though only one of the three cryptos listed above has privacy features, the popular altcoins are widely used. However, some markets have seen exclusive use of Monero because of its encrypted web features, Chainalysis management said.
Altcoins are even more distant as operations grow in size and scale. According to Bitfury's Crystal Blockchain report, in the first quarter of 2020, darknet entities received more than $ 384 million in Bitcoin and more than $ 411 million was sent, where the recipients of these transactions are exchanges divided between those that have verification requirements and those that do not.
Unlike high-value Bitcoin transactions, Grauer and Lopez-Penalver added that altcoins are only used for smaller darknet transactions.
Technical Market Outlook:
The BTC/USD pair has been trading around the 38% Fibonacci retracement of the last wave down that is located at the level of $9,157. The bears had pushed the price down from the local high made at the level of $9,201, but the price did not come back under the short-term trend line. The momentum remains neutral which indicates another sideways day. The next targets for bulls are seen at the levels of $9,209 and $9,261. The nearest technical support is located at $9,095.
Weekly Pivot Points:
WR3 - $9,569
WR2 - $9,411
WR1 - $9,271
Weekly Pivot - $9,117
WS1 - $8,968
WS2 - $8,812
WS3 - $8,862
Trading Recommendations:
The volatility on Bitcoin has been subdued for more than two months now, so the larger time frame trend remains down and as long as the level of $10,791 is not violated, all rallies will be treated as a counter-trend corrective moves. This is why the short positions are now more preferred until the level of $10,791 is clearly violated. The key mid-term technical support is located at the level of $7,897.
Analysis are provided byInstaForex.
-
22-07-2020, 07:31 AM #3060Senior Investor
- Join Date
- Aug 2012
- Posts
- 1,942
- Feedback Score
- 0
- Thanks
- 0
- Thanked 0 Times in 0 Posts
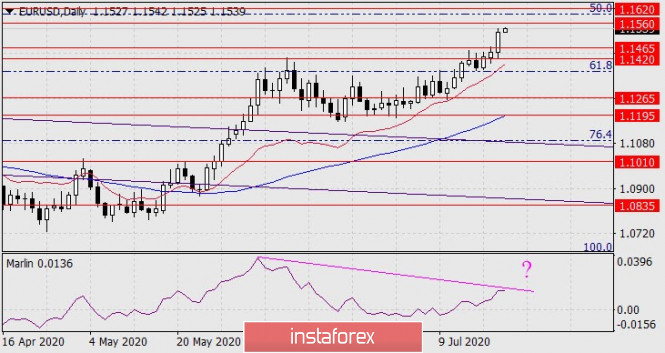
Forecast for EUR/USD on July 22, 2020
EUR/USD The euro rose by 78 points yesterday due to information that the 750 billion euro fund for the EU's recovery from coronavirus has finally been created. The momentum that the euro received could still grow towards the yet-to-be-reached target of 1.1560, possibly to 1.1620, but along with the fading news itself and local market overheating, which is signaled by the Marlin oscillator forming a divergence with the price, a subsequent reversal of the euro down into the range of 1.195-1.1265 is likely.
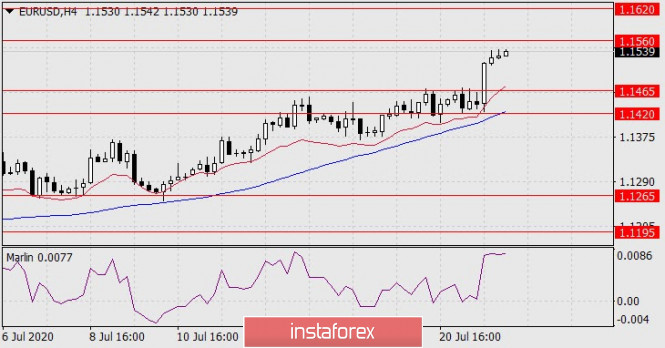
The price is growing above the balance and MACD lines on the H4 chart, the Marlin oscillator is actively growing and is close to overbought.
The current situation in the euro is such that it is no longer advisable to buy, and too early to sell. Even if we assume the option with a further medium-term rise of the single currency, it is better to wait for the price to pull back, which will occur, at least, in the range of 1.1420/65.
Analysis are provided byInstaForex.
-
Sponsored Links


 Reply With Quote
Thread Information
Users Browsing this Thread
There are currently 1 users browsing this thread. (0 members and 1 guests)
 Posting Permissions
24 Hour Gold

Advertising
- Over 20.000 UNIQUE Daily!
- Get Maximum Exposure For Your Site!
- Get QUALITY Converting Traffic!
- Advertise Here Today!
Out Of Billions Of Website's Online.
Members Are Online From.
- Get Maximum Exposure For Your Site!
- Get QUALITY Converting Traffic!
- Advertise Here Today!
Out Of Billions Of Website's Online.
Members Are Online From.


