
 LinkBack URL
 About LinkBacks
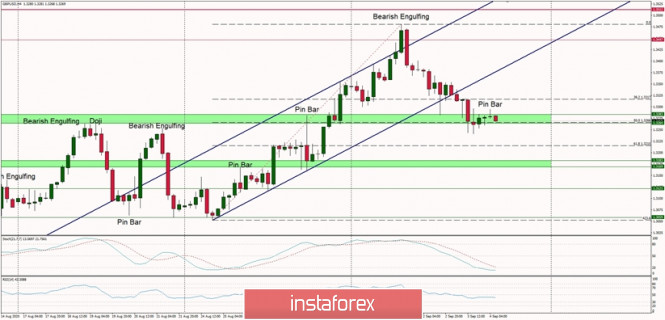
Technical Analysis of GBP/USD for September 4, 2020
Technical Market Outlook:
The GBP/USD pair has felt out of the parallel channel and made a new local low at the level of 1.3241, slightly below the 50% Fibonacci retracement seen at the level of 1.3266. The next technical support is seen at the level of 1.3215 and 1.3183. This is the immediate support for bulls and a clear violation of this level will be an intraday bearish signal. Weekly and monthly time frame trend remains up, so if the bullish pressure sustain, then the next target for bulls is seen at the level of 1.3447. Please notice, the market conditions are now oversold on the H4 time frame chart, so after a spike down a relief rally might occur.
Weekly Pivot Points:
WR3 - 1.3797
WR2 - 1.3564
WR1 - 1.3482
Weekly Pivot - 1.3256
WS1 - 1.3192
WS2 - 1.2962
WS3 - 1.2882
Trading Recommendations:
On the GBP/USD pair the main, multi-year trend is down, which can be confirmed by the down candles on the monthly time frame chart. Nevertheless, the recent rally form the multi-year lows seen at the level of 1.1404 has been successful and the trend might be reversing. The key long-term technical resistance is seen at the level of 1.3518. Only if one of these levels is clearly violated, the main trend might reverse (1.3518) or accelerate towards the key long-term technical support is seen at the level of 1.1404.
Analysis are provided byInstaForex.
Please visit our sponsors
Results 3,091 to 3,100 of 4086
Thread: InstaForex Wave Analysis
-
04-09-2020, 07:41 AM #3091Senior Investor


- Join Date
- Aug 2012
- Posts
- 1,942
- Feedback Score
- 0
- Thanks
- 0
- Thanked 0 Times in 0 Posts

-
07-09-2020, 06:52 AM #3092Senior Investor
- Join Date
- Aug 2012
- Posts
- 1,942
- Feedback Score
- 0
- Thanks
- 0
- Thanked 0 Times in 0 Posts
Technical Analysis of BTC/USD for September 7, 2020
Crypto Industry News:
British multinational security company BAE Systems and the Society for Worldwide Interbank Financial Telecommunication, have published a report revealing how cybercriminals launder cryptocurrencies.
Cryptocurrency laundering is still relatively small compared to the massive amounts of money laundered by traditional methods such as bank transfers, according to a Follow the Money study.
But there are a few notable examples and the report delves into the money laundering methods employed by the Lazarus Group, a well-known hacking gang sponsored by the North Korean regime.
Lazarus typically steals cryptocurrencies from an exchange and then starts relaying transactions through various exchanges using what is called a "tiered technique."
Hackers hire East Asian helpers who receive some of the stolen funds to help with their laundry. These facilitators are transferring cryptocurrencies to multiple addresses they own to "obscure the origins of the funds," the study found.
Facilitators transfer some of the funds received via newly added bank accounts that are linked to their stock exchange account - this allows you to convert the cryptocurrency into a fiat currency. Other stolen funds can be transferred in Bitcoin to prepaid gift cards that can be used on other exchanges to purchase additional Bitcoins.
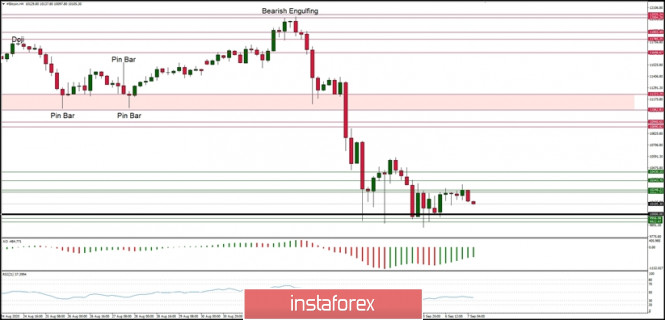
Technical Market Outlook:
The BTC/USD pair has bounced slightly from the level of $9,865 which was the low made during the last wave down from $12,004. The market is hovering around the level of $10,000 again as this is very important psychological level for market participants. The nearest technical resistance is seen at the level of $10,248, $10 343 and $10,430 and the nearest technical support is seen at the level of $9,704. The market conditions are oversold, but the momentum remains weak and negative, so another wave down might be just around the corner.
Weekly Pivot Points:
WR3 - $13,397
WR2 - $12,625
WR1 - $11,243
Weekly Pivot - $10,566
WS1 - $9,071
WS2 - $8,375
WS3 - $6,978
Trading Recommendations:
The weekly trend on the BTC/USD pair remains up and there are no signs of trend reversal, so buy orders are preferred in the mid-term. All the dynamic correction are still being used to buy the dips. The next mid-term target for bulls is seen at the level of $13,712. The key mid-term technical support is seen at the level of $10,463 and $10,000.
Analysis are provided byInstaForex.
-
08-09-2020, 06:16 AM #3093Senior Investor
- Join Date
- Aug 2012
- Posts
- 1,942
- Feedback Score
- 0
- Thanks
- 0
- Thanked 0 Times in 0 Posts
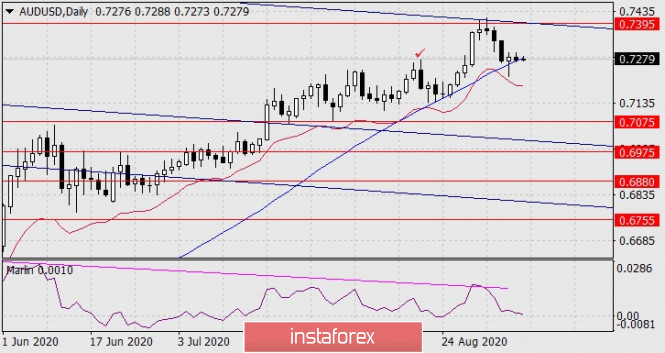
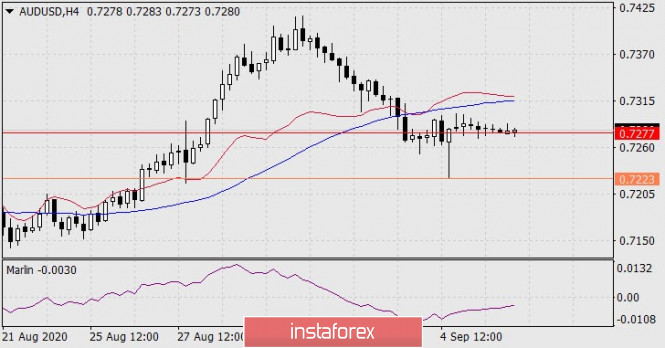
Forecast for AUD/USD on September 8, 2020
AUD/USD
The Australian dollar is on the MACD line on the daily chart. Setting the price below it can trigger a medium-term decline with a movement of about 4.5-5 figures. A condition that can confirm the medium-term decline is when the price leaves the area below the low of 0.7223. The first target will be the August 3 low at 0.7075. Also, in order for the price to confidently settle under the MACD line (0.7277), the aussie needs the signal line of the Marlin oscillator to fall into the zone of negative values.
The situation is also neutral on the 4-hour timeframe. The price is consolidating at the 0.7277 level. The Marlin oscillator moves gently, it can lie in the horizon without entering the growing trend zone. We are waiting for the development of events.
Analysis are provided byInstaForex.
-
09-09-2020, 07:32 AM #3094Senior Investor
- Join Date
- Aug 2012
- Posts
- 1,942
- Feedback Score
- 0
- Thanks
- 0
- Thanked 0 Times in 0 Posts
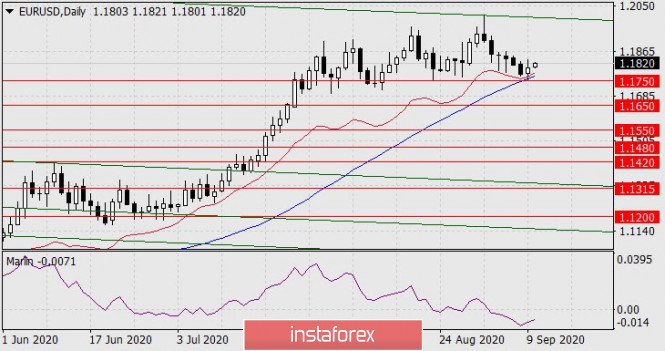
Forecast for EUR/USD on September 9, 2020
EUR/USD
The euro fell by 37 points on Tuesday, still hesitating to take decisive action, as is the case with the pound, or at least with the aussie. Investors may still be hoping for positive messages from the European Central Bank on Thursday, but the ECB will not rush to sound an alarm on Brexit, and the negative pressure from the UK is growing every day.
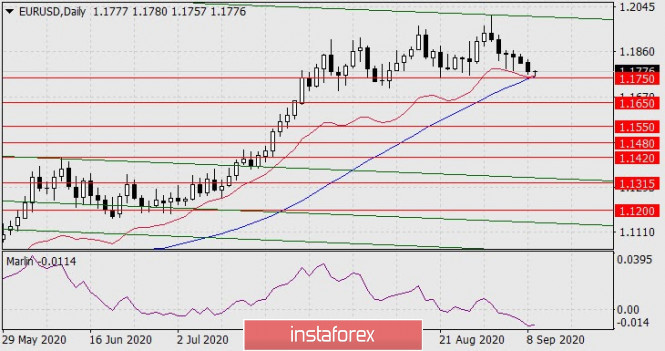
But on the technical side, the euro quote will have to deal with the support of the MACD line on the daily chart, this is the 1.1750 level. The price falling in the area under it opens the first target at 1.1650. The medium-term prospect for a decline of 1.1315 is support for the embedded price channel line. It is marked in green on the chart. Taking the euro's resilience to the current political turmoil into account, we assume that the price will move from side to side until tomorrow's ECB meeting.
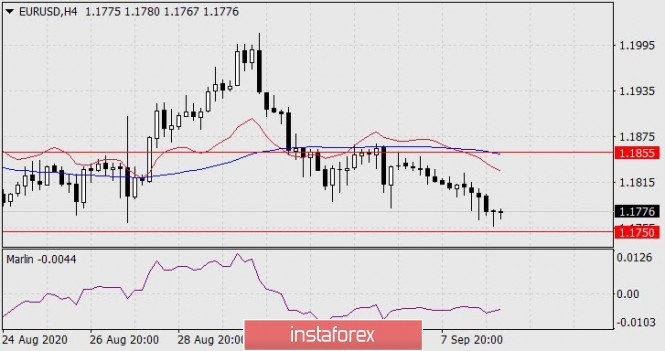
The price is slightly correcting from the key level of 1.1750 on the four-hour chart. The leading Marlin oscillator is in no hurry to decline, which may also play into the euro's hands in its desire to take a closer look at the external situation and clarify the central bank's intentions. The upper limit of the waiting range is determined by the MACD line - the level 1.1855.
Analysis are provided byInstaForex.
-
10-09-2020, 07:11 AM #3095Senior Investor
- Join Date
- Aug 2012
- Posts
- 1,942
- Feedback Score
- 0
- Thanks
- 0
- Thanked 0 Times in 0 Posts
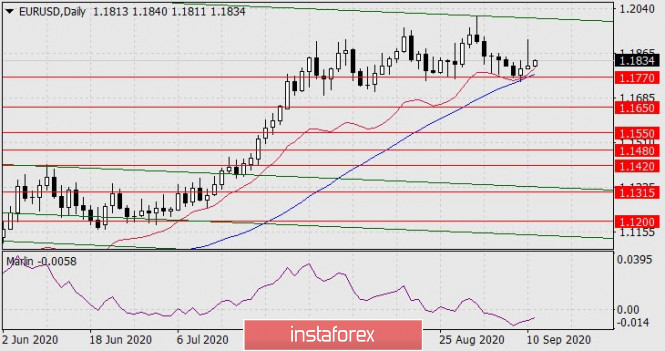
Forecast for EUR/USD on September 10, 2020
EUR/USD
So we are approaching the ECB meeting, and as is almost always the case, from a technical point of view, the euro approached this event in a neutral stance. At the same time, the financial media carefully presented various opinions about the central bank's upcoming assessment of economic prospects. If the ECB really intends to lower the euro (protect the 1.20 level), which is already rumored since the central bank suggested it, then ECB President Christine Lagarde only has verbal tools, up to threats to lower the rate again "if the situation worsens".
The daily chart shows that the price stopped at the MACD line, and the Marlin oscillator is in the lower area. As before, we are waiting for the price to break through, but this may happen after spikes in both directions, since major players are very eager to take positions accumulated before such an intriguing ECB meeting.
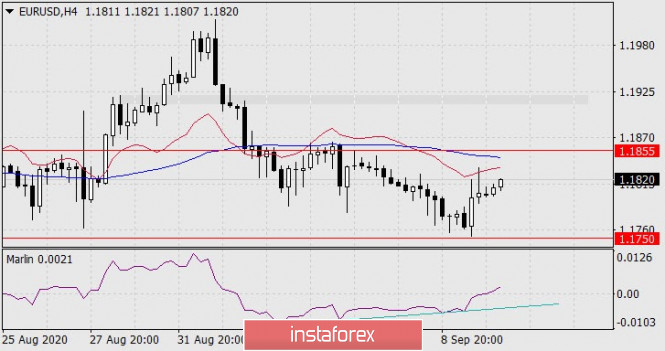
The four-hour chart shows the price in the 1.1750-1.1855 range indicated earlier. Not strong, but a double convergence on the Marlin oscillator with the signal line entering the zone of positive values indicates a more probable primary price surge. Of course, it is not limited to the 1.1855 level. There is a small accumulation zone in the 1.1925 area.
Analysis are provided byInstaForex.
-
11-09-2020, 07:08 AM #3096Senior Investor
- Join Date
- Aug 2012
- Posts
- 1,942
- Feedback Score
- 0
- Thanks
- 0
- Thanked 0 Times in 0 Posts
Forecast for EUR/USD on September 11, 2020
EUR/USD
Yesterday's ECB meeting, as we expected, did not provide any surprises. The European Central Bank did not shock the public with a desire to control the euro exchange rate, refuse any targets, and only discussed the impact of the euro's current rate on the economy. The changes only affected the ECB's own forecast for GDP for the current year, which improved from -8.7% to -8.0%. There was no strong volatility in the market. The euro jumped by 110 points, but there was no significant reversal; the euro grew by 12 points by the end of the day.
The MACD line has slightly increased on the four-hour chart, now the price needs to settle below the 1.1770 level in order to move towards 1.1650 and lower target levels.
The price reached the second expected volatility level of 1.1920 on the four-hour chart, afterwards it fell and settled under the MACD line. The signal line of the Marlin oscillator is in the zone of positive values, therefore, preparing to fall further will take about two bars, that is, by tonight. Perhaps even longer. The 1.1770 level is strong enough. If there was no such attempt yesterday, the big players are unlikely to attack it today.
So, we expect a sideways trend today, in preparation for an attack on 1.1770 next week.
Analysis are provided byInstaForex.
-
14-09-2020, 06:36 AM #3097Senior Investor
- Join Date
- Aug 2012
- Posts
- 1,942
- Feedback Score
- 0
- Thanks
- 0
- Thanked 0 Times in 0 Posts
Forecast for GBP/USD on September 14, 2020
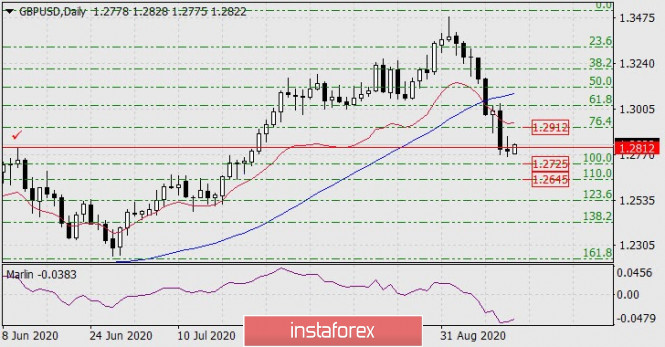
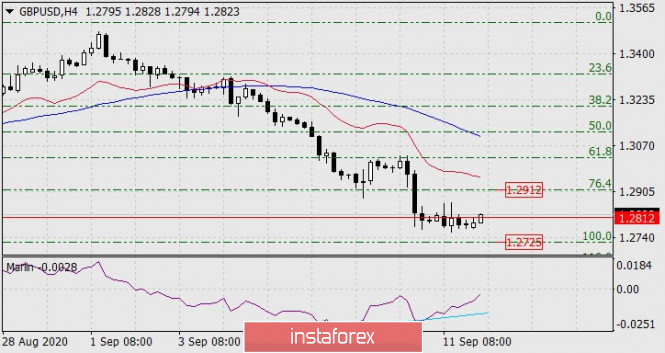
GBP/USD
The pound sterling was not able to develop a corrective growth last Friday, so it ended the day by falling, but the correction receives a new impetus today in the Asian session, the price went above the 1.2812 level, heading towards the 1.2912 correction target at the 76.4% Fibonacci level. The signal line of the Marlin oscillator is moving up, which is a signal for a correction.
The price continues to converge with Marlin on the four-hour chart. We are waiting for the correction to end at the target level of 1.2912, and then a reversal into a new downward trend with targets at 1.2725, 1.2645.
Analysis are provided byInstaForex.
-
15-09-2020, 06:56 AM #3098Senior Investor
- Join Date
- Aug 2012
- Posts
- 1,942
- Feedback Score
- 0
- Thanks
- 0
- Thanked 0 Times in 0 Posts
Forecast for EUR/USD on September 15, 2020
The euro, having felt little resistance, grew by 18 points on Monday, following the momentum of the previous days. Meanwhile, British MPs in the second reading passed a law on the internal market last night, contrary to international law (which is what Prime Minister Boris Johnson meant when he spoke of the superiority of British laws). The law is sent to the authorities, and this cannot but put pressure on both the pound and the euro.
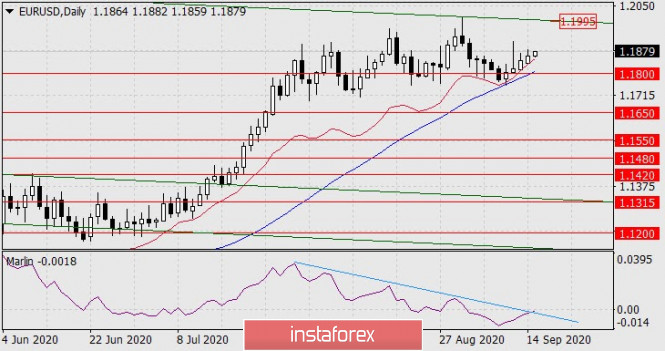
The price is above the red balance indicator line on the daily chart, above the MACD line (blue), but the Marlin oscillator signal line touches its own trend line near the border of the growth area. The price could reverse from the current levels. If the price moves under the MACD line, below the 1.1800 level, it will cause the euro to fall towards the first target of 1.1650.
But this has not happened yet, therefore, this plan may not be realized and the price will continue to rise to the upper border of the price channel in the 1.1995 area.
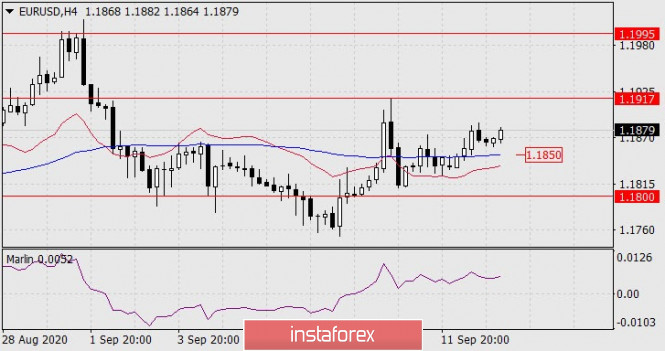
The price settled above the MACD line on the four-hour chart, while Marlin is in the growing trend zone. Breaking through the September 10 high (1.1917) is a signal that the price could rise to 1.1995. But the price did not break far from the MACD line, and the line itself moves horizontally, that is, the prospects for a short-term trend is not very noticeable. The option that the price would move down has a 45% probability. We are waiting for the development of events. Probably, the final choice will take place at the Federal Reserve meeting tomorrow.
Analysis are provided byInstaForex.
-
16-09-2020, 07:20 AM #3099Senior Investor
- Join Date
- Aug 2012
- Posts
- 1,942
- Feedback Score
- 0
- Thanks
- 0
- Thanked 0 Times in 0 Posts
Technical Analysis of EUR/USD for September 16, 2020
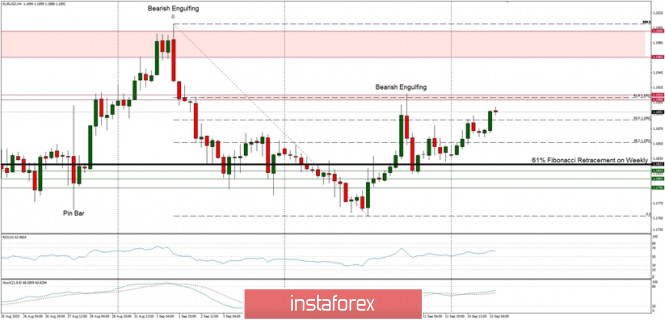
Technical Market Outlook:
Another Bearish Engulfing candlestick pattern on H4 time frame has made the market to reverse at the level of 1.1899 and hit the level of 61% Fibonacci retracement located at 1.1822 again. The bulls were unable to break through the retracement located at the level of 1.1912 and the rally was reversed. The bulls are still trying to resume the rally, but the level of 1.1912 has not been violated yet. Any intraday breakout below the level of 1.1813 will accelerate the sell-off towards the level of 1.1753 again, so it is worth to keep an eye on the next developments. The weekly trend remains up,
Weekly Pivot Points:
WR3 - 1.2085
WR2 - 1.1993
WR1 - 1.1923
Weekly Pivot - 1.1829
WS1 - 1.1753
WS2 - 1.1670
WS3 - 1.1589
Trading Recommendations:
On the EUR/USD pair the main trend is up, which can be confirmed by almost 10 weekly up candles on the weekly time frame chart and 4 monthly up candles on the monthly time frame chart. Nevertheless, weekly chart is recently showing some weakness in form of a several Pin Bar candlestick patterns at the recent top. This means any corrections should be used to buy the dips until the key technical support is broken. The key long-term technical support is seen at the level of 1.1445. The key long-term technical resistance is seen at the level of 1.2555.
Analysis are provided byInstaForex.
-
17-09-2020, 07:25 AM #3100Senior Investor
- Join Date
- Aug 2012
- Posts
- 1,942
- Feedback Score
- 0
- Thanks
- 0
- Thanked 0 Times in 0 Posts
Elliott wave analysis of GBP/JPY for September 17, 2020
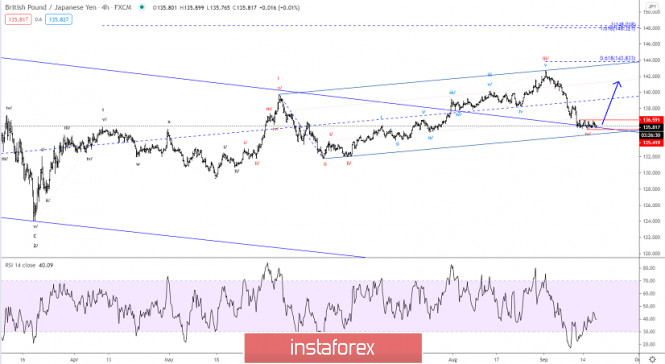
Technical Market Outlook:
GBP/JPY remains locked inside the sideways consolidation between 135.41 and 136.59 and we will need a break out of this consolidation-area for the next meaningfull move. We prefer a break above resistance at 136.59, but the longer GBP/JPY stays locked inside this sideways consolidation, the risk for a break below support at 135.41 rises for a final spike towards 133.87.
A break above 136.59 will confirm that red wave iv/ has completed and red wave v/ to above 142.72 is in motion.
R3: 137.10
R2: 136.60
R1: 136.06
Pivot: 135.90
S1: 135.75
S2: 135.50
S3: 135.25
Trading recommendation:
We are long GBP from 135.55 and we will move our stop to 135.35
Analysis are provided byInstaForex.
-
Sponsored Links


 Reply With Quote
Thread Information
Users Browsing this Thread
There are currently 2 users browsing this thread. (0 members and 2 guests)
 Posting Permissions
24 Hour Gold

Advertising
- Over 20.000 UNIQUE Daily!
- Get Maximum Exposure For Your Site!
- Get QUALITY Converting Traffic!
- Advertise Here Today!
Out Of Billions Of Website's Online.
Members Are Online From.
- Get Maximum Exposure For Your Site!
- Get QUALITY Converting Traffic!
- Advertise Here Today!
Out Of Billions Of Website's Online.
Members Are Online From.


