Technical analysis of AUD/USD for July 04, 2018
Overview:
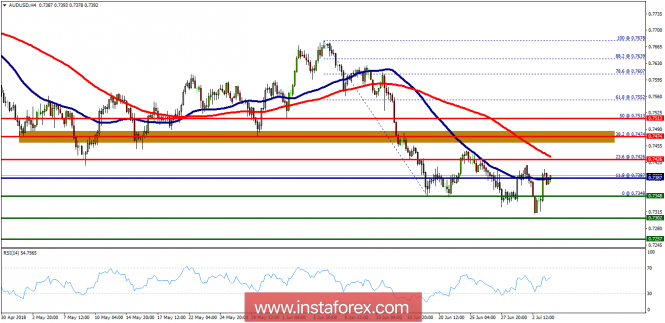
Last week, the AUD/USD pair fell from the level of 0.7474 towards 0.7348. Now, the price is set at 0.7371. The resistance is seen at the levels of 0.7426 and 0.7474. Moreover, the price area of 0.7474 remains a significant resistance zone. Therefore, there is a possibility that the AUD/USD pair will move downside and the structure of a fall does not look corrective. The trend is still below the 100 EMA for that the bearish outlook remains the same as long as the 100 EMA is headed to the downside. Thus, amid the previous events, the price is still moving between the levels of 0.7426 and 0.7257. If the AUD/USD pair fails to break through the resistance level of 0.7426, the market will decline further to 0.7474 as the first target. This would suggest the bearish market because the RSI indicator is still in a negative spot and does not show any trend-reversal signs. The pair is expected to drop lower towards at least 0.7302 so as to test the daily support 2. On the other hand, if a breakout takes place at the resistance level of 0.7474, then this scenario may become invalidated.
Analysis are provided byInstaForex.
Please visit our sponsors
Results 2,571 to 2,580 of 4086
Thread: InstaForex Wave Analysis
-
04-07-2018, 05:30 AM #2571

-
05-07-2018, 05:42 AM #2572

Technical analysis: Intraday Level For EUR/USD, July 05, 2018
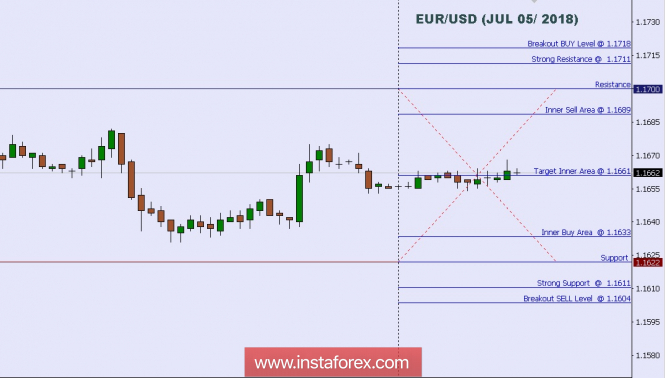
When the European market opens, some Economic Data will be released such as French 10-y Bond Auction, Spanish 10-y Bond Auction, Retail PMI, and German Factory Orders m/m. The US will release the Economic Data too, such as Crude Oil Inventories, ISM Non-Manufacturing PMI, Final Services PMI, Unemployment Claims, ADP Non-Farm Employment Change, and Challenger Job Cuts y/y, so, amid the reports, EUR/USD will move in a medium to high volatility during this day.
TODAY'S TECHNICAL LEVEL:
Breakout BUY Level: 1.1718.
Strong Resistance:1.1711.
Original Resistance: 1.1700.
Inner Sell Area: 1.1689.
Target Inner Area: 1.1661.
Inner Buy Area: 1.1633.
Original Support: 1.1622.
Strong Support: 1.1611.
Breakout SELL Level: 1.1604.
Analysis are provided byInstaForex.
-
06-07-2018, 05:29 AM #2573

Technical analysis of NZD/USD for July 06, 2018
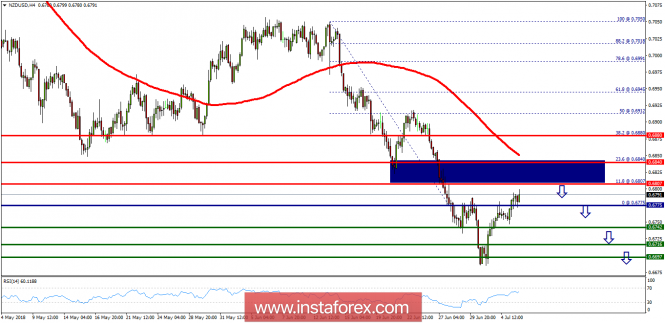
The NZD/USD (kiwi) pair continues to move downwards from the level of 0.6840. This week, the pair dropped from the level of 0.6840 to trade around the 0.6775 level. This level of 0.6840 coincides with the major resistance today. Today, the first resistance level is seen at 0.6840 followed by 0.6880, while daily support 1 is found at 0.6742. Also, the level of 0.6775 represents a key price today for that it is acting as major resistance/support this week. Amid the previous events, the pair is still in a downtrend, because the NZD/USD pair is trading in a bearish trend from the new resistance line of 0.6840/0.6807 towards the first support level at 0.6742 in order to test it. If the pair succeeds to pass through the level of 0.6742, the market will indicate a bearish opportunity below the level of 0.6742. Then, resell again at the price of 0.6742 with the targets of 0.6716 and 0.6697. On the other hand, if a breakout happens at the resistance level of 0.6840, then this scenario may be invalidated.
Analysis are provided byInstaForex.
-
09-07-2018, 07:16 AM #2574

Technical analysis: Intraday Level For EUR/USD, July 09, 2018
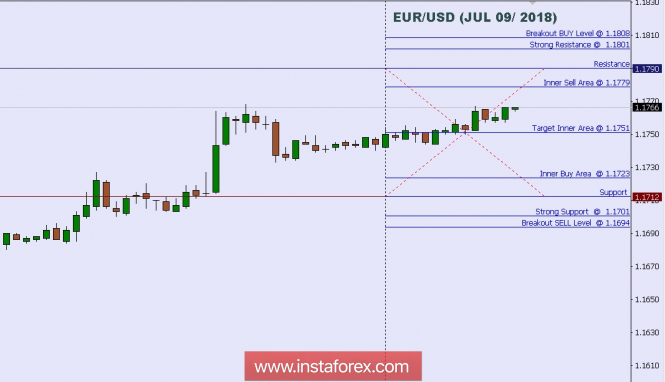
When the European market opens, some Economic Data will be released such as Sentix Investor Confidence, and German Trade Balance. The US will also release the Economic Data such as Consumer Credit m/m, so amid the reports, EUR/USD will move in a low to medium volatility during this day.
TODAY'S TECHNICAL LEVEL:
Breakout BUY Level: 1.1808.
Strong Resistance:1.1801.
Original Resistance: 1.1790.
Inner Sell Area: 1.1779.
Target Inner Area: 1.1751.
Inner Buy Area: 1.1723.
Original Support: 1.1712.
Strong Support: 1.1701.
Breakout SELL Level: 1.1694.
Analysis are provided byInstaForex.
-
10-07-2018, 06:13 AM #2575

Wave analysis of EUR / USD. The euro continues to adhere to the working scenario
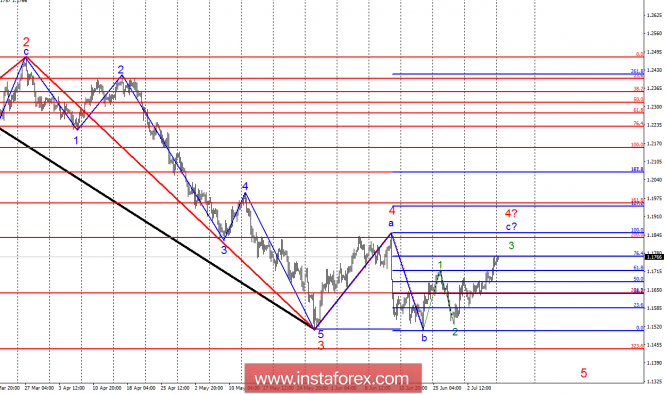
Analysis of wave counting:
During the trades on Friday, the currency pair EUR / USD added about 50 percentage points, remaining thus in the stage of construction of the proposed wave 3, c, 4. If this is the case, then the quotes will continue to rise with targets near the mark of 1.1856, which corresponds to 100.0% of Fibonacci, and higher. The wave c can assume a pronounced 5-wave structure, which allows one to assume the growth of the pair to area 20 of the figure. The construction of wave 5 of the downward trend section is being postponed for an indefinite period.
The objectives for the option with sales: 1.1440 - 323.6% of the Fibonacci of the highest order
1,1118 - 423.6% of Fibonacci
The objectives for the option with purchases:
1.1866 - 100.0% of Fibonacci
1.2072 - 127.2% of Fibonacci
General conclusions and trading recommendations:
The pair EUR / USD continues to rise within wave 3, c, 4. Thus, on July 9 I recommend to remain in purchases with targets located near the calculated marks of 1.1856 and 1.2072, which corresponds to 100.0% and 127.2% of Fibonacci. Return to sales, I recommend after receiving confirmation of the completion of the entire wave 4. At the moment there is no sign of the completion of the construction of this wave.
Analysis are provided byInstaForex.
-
11-07-2018, 06:21 AM #2576

Brent disobeyed the president
Interruptions in supplies in Libya, Venezuela, Canada and Norway, Iran's threats to block the Strait of Hormuz, and some weakness of the US dollar after the release of the US labor market report for June allowed the bulls for Brent and WTI to continue the rally. If oil can update the May highs, the road in the direction of $ 83-85 per barrel will be opened. According to Tehran, the aim of restraining the price of black gold tweets of Donald Trump, in fact, can bring the North Sea grade to the psychologically important mark of $ 100 per barrel. Who is bigger? Sanford C. Bernstein & Co draws attention to the reduction in oil companies' stocks by an average of 30% since the beginning of 2000 and the increase in urban population in Asia by 1 billion over the next two decades. As a result, the demand for cars and gasoline will rise sharply, which will launch a new super cycle on black gold and allow it to grow to $ 150 per barrel.
The US president demands from his military allies (primarily from Saudi Arabia) to increase production to 2 million bpd, knowing full well that the OPEC decisions on the curtailment of the production of "bulls" for Brent and WTI at the end of June cannot be stopped. The states are exerting pressure on buyers of Iranian oil, and if their plan to reduce exports from this Middle Eastern country translates into life, then the market will take 2.5 million bpd. Tehran is the fifth oil producer in the world with a production volume of 3.8 million bpd. The country's leadership claims that it is ready to sell as much black gold as it can.
The support of Brent and WTI is provided by the factor of production reduction in Libya from 1.28 million bpd in February to the current 527 thousand bpd. According to Capital Economics estimates, the market may lose about 2 million bpd from Iran and 1 million bpd from Venezuela, which will widen the deficit and help develop the "bullish" conjuncture of the black gold market.
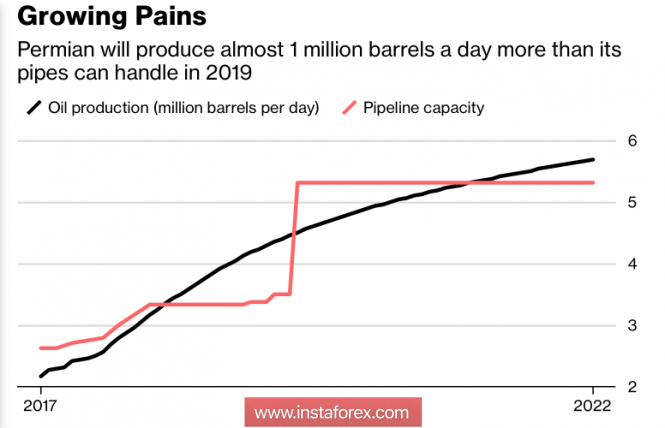
At first glance, instead of putting pressure on OPEC, Donald Trump could spur the activity of American producers. For a long time, the oil market was living in tug-of-war conditions between those working on reducing the cartel's output and companies from the States that used price increases to hike their own production and simultaneously hedge the risks. They let the number of drilling rigs from Baker Hughes grow (+5 to 863 in the week of July 6), and the Energy Information Administration forecasts an increase in production to a record 11.8 million bpd, no problems with the infrastructure have been canceled. For example, in the Perm basin in 2019 will produce 1 million bpd more than its pipes can afford to pump.
Extraction and power of pipelines
The hand to help the "bulls" for Brent and WTI is fixing profit to the US dollar after the publication of disappointing statistics on US unemployment and the average wage. The first indicator increased from 3.8% to 4%, the second did not reach the forecasts of experts from Bloomberg (+ 0.2% vs. + 0.3% m / m)
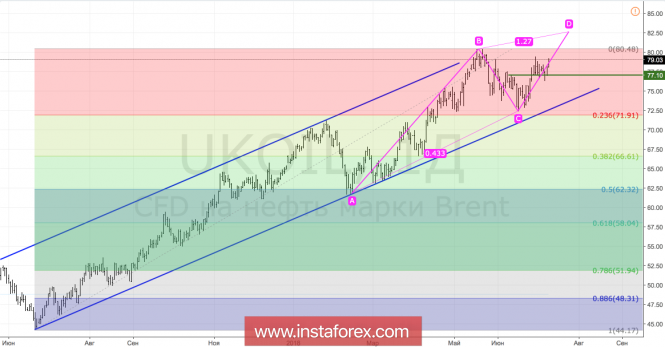
Technically, a breakthrough of resistance at $ 79.5 and $ 80.5 per barrel will open the "bulls" along Brent road to the north in the direction of the target for 127.2% and 161.8% for the AB = CD pattern.
Brent, daily chart
Analysis are provided byInstaForex.
-
12-07-2018, 07:21 AM #2577

Trading Plan for EUR/USD for July 12, 2018
Technical outlook:
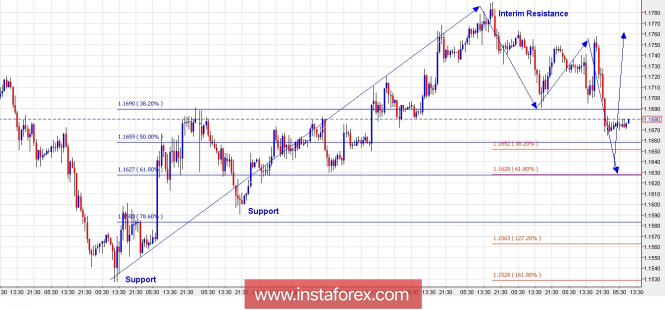
The hourly EUR/USD chart presented here indicates that the currency pair is dropping in a corrective manner since printing highs at the 1.1790 levels recently. At this point in time, prices are finding support at a past resistance turned support zone around the 1.1660/70 levels. According to the Fibonacci extensions displayed here, it remains quite possible for the pair to drop through the 1.1650/30 levels to find further support before turning higher. The price support is seen at the 1.1590 levels, followed by the 1.1530 levels, respectively, while interim resistance is seen at the 1.1790 levels. Most probable direction is to push higher at least one last time towards 1.1850 and above, before reversing lower again. Please note that in the medium term, till the prices remain below the 1.2150 levels, bears shall be in complete control.
Trade plan:
Aggressive traders, now look to buy again between the 1.1630/60 levels, with stop below 1.1550 and target above 1.1850.
Fundamental outlook:
Watch out for USD CPI at 0800 AM EST today.
Analysis are provided byInstaForex.
-
13-07-2018, 06:11 AM #2578

Technical analysis of NZD/USD for July 13, 2018
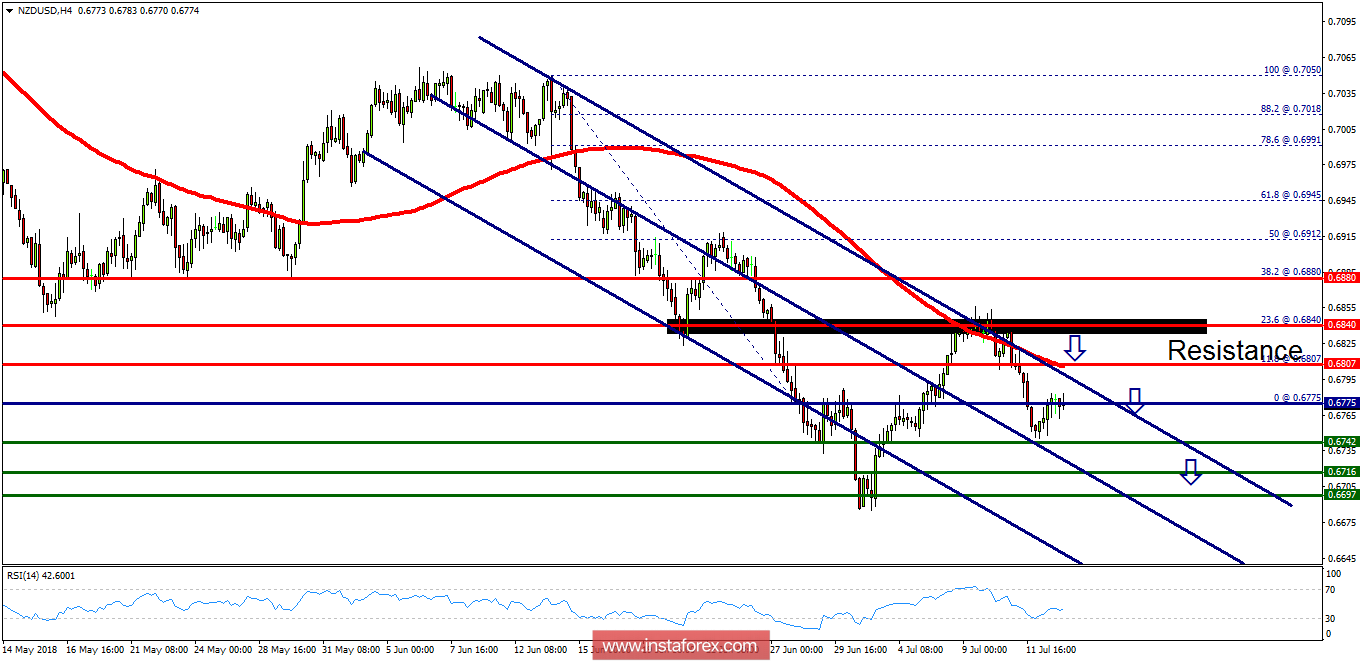
Overview: The NZD/USD pair continues to move downwards from the level of 0.6840 (23.6% of Fibonacci retracement). This week (from 9 to 13 July 2018), the pair has dropped from the level of 0.6840 to trade around the 0.6775 level. This level of 0.6840 coincides with the major resistance today. Today, the first resistance level is seen at 0.6840 followed by 0.6880, while daily support 1 is found at 0.6742. Also, the level of 0.6775 represents a key price today for that it is acting as major resistance/support this week. Amid the previous events, the pair is still in a downtrend, because the NZD/USD pair is trading in a bearish trend from the new resistance line of 0.6840/0.6807 towards the first support level at 0.6742 in order to test it. If the pair succeeds to pass through the level of 0.6742, the market will indicate a bearish opportunity below the level of 0.6742. Then, resell again at the price of 0.6742 with the targets of 0.6716 and 0.6697. On the other hand, if a breakout happens at the resistance level of 0.6843, then this scenario may be invalidated.
Analysis are provided byInstaForex.
-
16-07-2018, 06:55 AM #2579

Technical analysis of Bitcoin For July 16, 2018
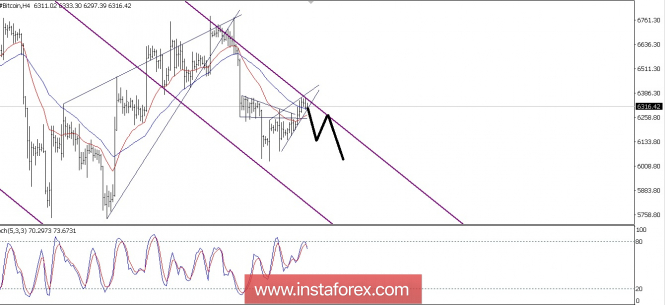
The Bitcoin at the 4-hour charts looks clearly moving in a Bearish bias. This can be confirmed by the price still moving in a down slope channel and the Exponential Moving Average period 21 still bellow the Linear Weighted Moving Average period 55, as long as the price does not break out and close above the 6,360.51, it is highly likely the bias from this cryptocurrency will still be in a Bearish condition.
Analysis are provided byInstaForex.
-
17-07-2018, 06:34 AM #2580

Technical analysis: Intraday Level For EUR/USD, July 17, 2018
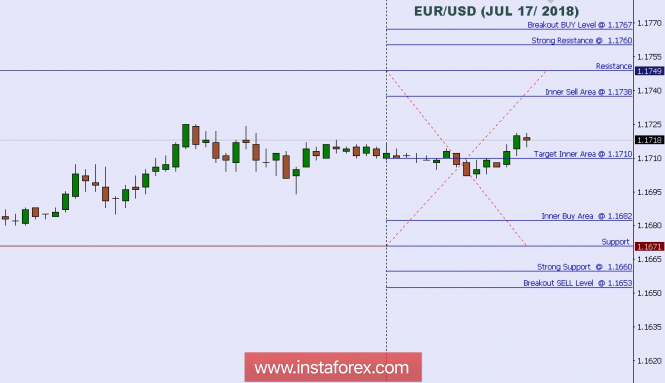
When the European market opens, there's no Economic Data will be released from the Euro Zone, but The US will release the Economic Data such as TIC Long-Term Purchases, NAHB Housing Market Index, Industrial Production m/m, and Capacity Utilization Rate, so, amid the reports, EUR/USD will move in a low to medium volatility during this day.
TODAY'S TECHNICAL LEVEL:
Breakout BUY Level: 1.1767.
Strong Resistance:1.1760.
Original Resistance: 1.1749.
Inner Sell Area: 1.1738.
Target Inner Area: 1.1710.
Inner Buy Area: 1.1682.
Original Support: 1.1671.
Strong Support: 1.1660.
Breakout SELL Level: 1.1653.
Analysis are provided byInstaForex.
-
Sponsored Links
Thread Information
Users Browsing this Thread
There are currently 2 users browsing this thread. (0 members and 2 guests)
24 Hour Gold
Advertising
- Over 20.000 UNIQUE Daily!
- Get Maximum Exposure For Your Site!
- Get QUALITY Converting Traffic!
- Advertise Here Today!
Out Of Billions Of Website's Online.
Members Are Online From.
- Get Maximum Exposure For Your Site!
- Get QUALITY Converting Traffic!
- Advertise Here Today!
Out Of Billions Of Website's Online.
Members Are Online From.


 LinkBack URL
 About LinkBacks


 Reply With Quote

