
 LinkBack URL
 About LinkBacks
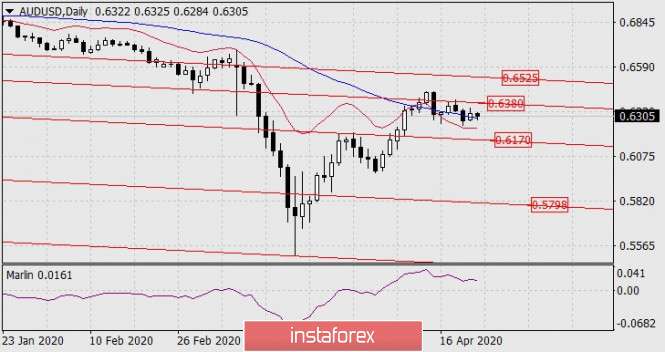
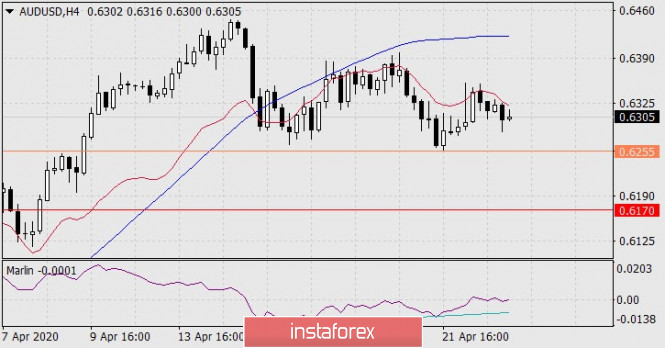
Forecast for AUD/USD on April 10, 2020
AUD/USD
The Australian dollar rose by 109 points on Thursday, halting growth before the MACD line on the daily scale chart. The price could turn down from the current levels, maybe a little later, with preliminary testing of the embedded line of the price channel at the level of 0.6400.
The condition for a reversal is that the price goes under the price channel line at 0.6185, and the movement is aimed at the trend line of 0.5815.
The Marlin oscillator forms a downward turn on the four-hour chart. The signal level of 0.6185 of the higher timeframe coincides with the April 1 peak (tick) and with the support of the MACD line, where it can be in a day, that is, on Monday morning.
Analysis are provided byInstaForex.
Please visit our sponsors
Results 2,991 to 3,000 of 4086
Thread: InstaForex Wave Analysis
-
10-04-2020, 05:23 AM #2991Senior Investor


- Join Date
- Aug 2012
- Posts
- 1,942
- Feedback Score
- 0
- Thanks
- 0
- Thanked 0 Times in 0 Posts

-
13-04-2020, 07:07 AM #2992Senior Investor
- Join Date
- Aug 2012
- Posts
- 1,942
- Feedback Score
- 0
- Thanks
- 0
- Thanked 0 Times in 0 Posts
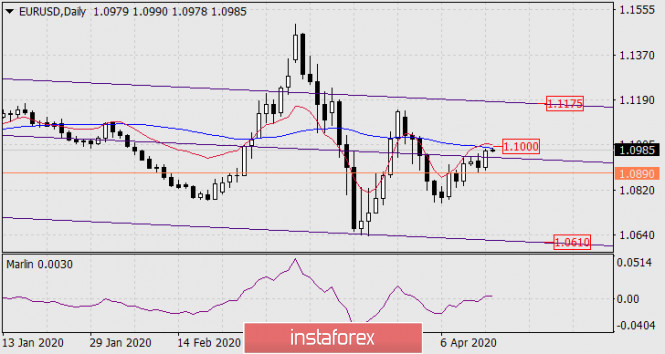
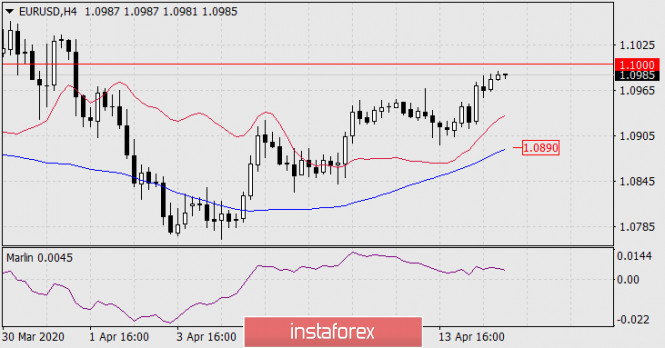
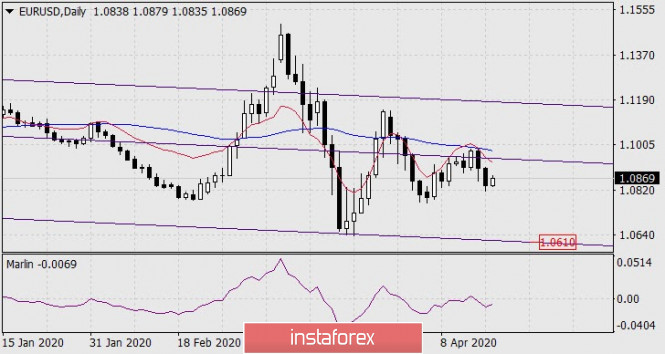
Forecast for EUR/USD on April 13, 2020
EUR/USD
The euro made minor fluctuations before the resistance of the embedded line of the downward price channel on Friday, as the markets in Europe and the United States were closed. The signal line of the Marlin oscillator unfolds from the border with the growth territory. A synchronous downward reversal of the price and the indicator is possible.
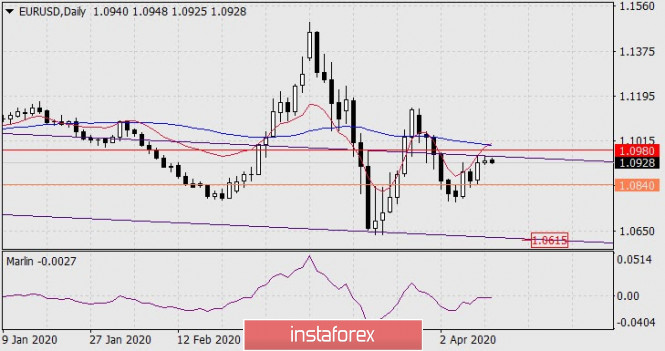
Marlin turned lower on the four-hour chart. A stable condition for the euro's fall is when the price leaves the area below the MACD line in 1.0840. In this case, the target of the movement is the lower line of the price channel at 1.0615 (daily).
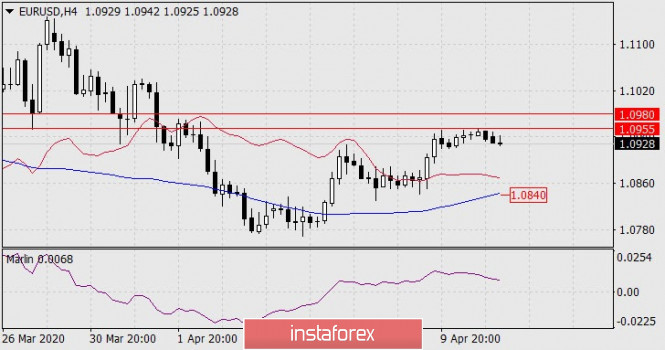
But until the signal level has been overcome, the price can still make a false puncture of the upper line of the price channel by testing the November 2019 low (1.0980), or the MACD line on the daily (blue indicator) in the area of 1.0990.
*The market analysis posted here is meant to increase your awareness, but not to give instructions to make a trade.
Analysis are provided byInstaForex.
-
14-04-2020, 07:02 AM #2993Senior Investor
- Join Date
- Aug 2012
- Posts
- 1,942
- Feedback Score
- 0
- Thanks
- 0
- Thanked 0 Times in 0 Posts
Forecast for EUR/USD on April 14, 2020
EUR/USD The euro fell by 22 points on Monday, rebounding from the blue line of the price channel on the daily chart. The leading indicator Marlin is in no hurry to turn around, holding on to the border with the territory of growth. This may be a sign of another small upward movement before the medium-term drop. The MACD line in the region of 1.0980 or slightly higher can be tested.
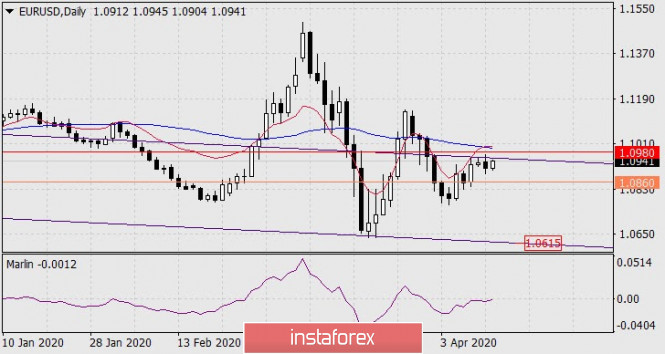
On the four-hour chart, the price develops above the indicator lines of balance and MACD, the signal line of the Marlin oscillator is confidently decreasing here, but has yet to leave the growth zone, which in total does not cancel the option with the final price increase. The situation will change abruptly to a downward trend with the price moving under the MACD line at 1.0860. The 1.0615 target will open – the embedded lower line of the price channel on the daily chart.
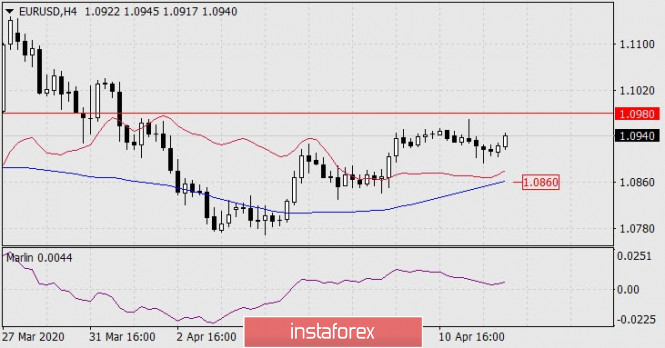
*The market analysis posted here is meant to increase your awareness, but not to give instructions to make a trade.
Analysis are provided byInstaForex.
-
15-04-2020, 07:23 AM #2994Senior Investor
- Join Date
- Aug 2012
- Posts
- 1,942
- Feedback Score
- 0
- Thanks
- 0
- Thanked 0 Times in 0 Posts
Forecast for EUR/USD on April 15, 2020
EUR/USD
On Tuesday, the euro worked out an option with a push to the MACD line on the daily chart, but the market is starting to seriously try to move to the target of 1.1175 on the nested price channel line. This scenario will begin to be implemented with the release of prices above the MACD line, that is, above 1.1000. The signal line of the Marlin oscillator has entered the territory of a growing trend.
The price is rising on a four-hour chart, and it is above the balance and MACD line, while Marlin turned up before the division of trends.
The market still has a chance of a price reversal and a medium-term fall in the euro, but for this to happen, the price needs to consolidate under the MACD line, below 1.0890.
Thus, with the price above 1.1000, purchases with a take profit below 1.1175 and stop loss below 1.0950 (under the line of the price channel) can be opened. Sales, in turn, can be opened with withdrawal prices below 1.0890.
*The market analysis posted here is meant to increase your awareness, but not to give instructions to make a trade.
Analysis are provided byInstaForex.
-
16-04-2020, 06:38 AM #2995Senior Investor
- Join Date
- Aug 2012
- Posts
- 1,942
- Feedback Score
- 0
- Thanks
- 0
- Thanked 0 Times in 0 Posts
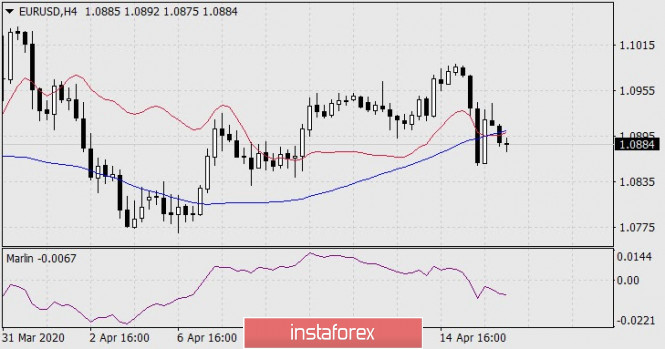
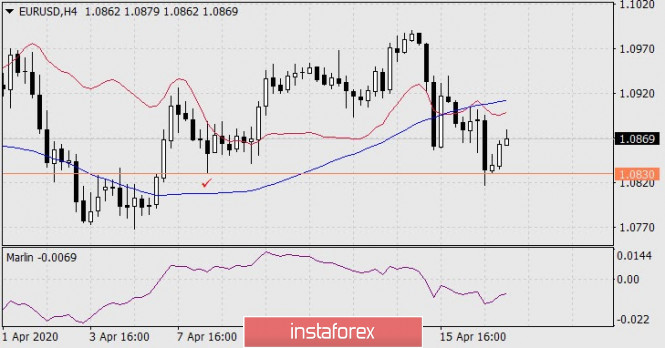
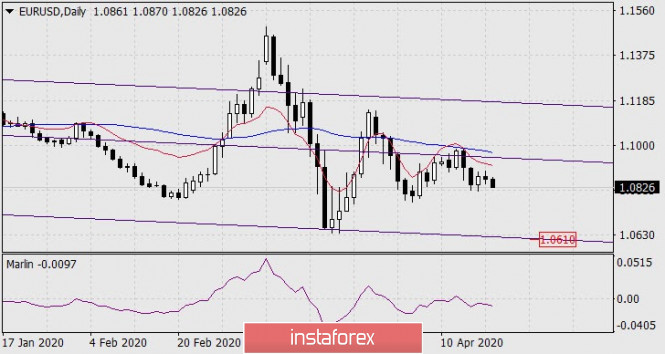
Forecast for EUR/USD on April 16, 2020
EUR/USD
The euro did not do anything unnecessary, nor did it make any false movements on Wednesday, turning down exactly from the MACD line on the daily chart. Simultaneously with the price reversal, the signal line of the Marlin oscillator turned down from the border of the growth territory (the exit above the zero line was insignificant, which can not even be called false). Now the euro's target is the embedded price channel line around 1.0610.
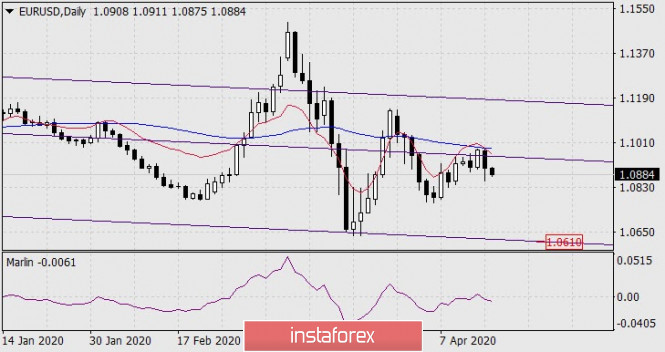
This morning, the price retreated under the balance and MACD indicator lines on the four-hour chart, the Marlin oscillator has consolidated on the declining trend zone. We are expecting the price to fall to the designated goal.
*The market analysis posted here is meant to increase your awareness, but not to give instructions to make a trade.
Analysis are provided byInstaForex.
-
17-04-2020, 06:23 AM #2996Senior Investor
- Join Date
- Aug 2012
- Posts
- 1,942
- Feedback Score
- 0
- Thanks
- 0
- Thanked 0 Times in 0 Posts
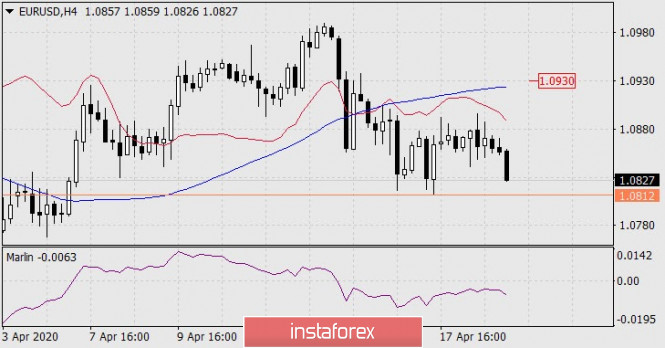
Forecast for EUR/USD on April 17, 2020
EUR/USD
The euro continued its planned decline from a technical point of view on Thursday. Losses amounted to 70 points as investors withdrew to a safe dollar, since the latest data on new weekly applications for unemployment benefits reached 5.245 million and bookmarks of new homes fell to 2.22 million in March against the expectation of 1.31 million. In addition, the business index activity in the manufacturing sector of Philadelphia fell from -12.7 to -56.6 in April, to a record since August 1980.
The price is decreasing under the balance and MACD indicator lines on the daily scale chart, and the Marlin oscillator is fixed in the decline zone. We expect the euro to support the embedded price channel line around 1.0610.
The price is also under the balance and MACD lines on the four-hour chart, Marlin is in the negative trend territory.
The signal level for opening sales is the April 8 low at a price of 1.0830. Stop loss at 1.0880, take profit before 1.0610. Intermediate goal of 1.0768.
*The market analysis posted here is meant to increase your awareness, but not to give instructions to make a trade.
Analysis are provided byInstaForex.
-
20-04-2020, 06:59 AM #2997Senior Investor
- Join Date
- Aug 2012
- Posts
- 1,942
- Feedback Score
- 0
- Thanks
- 0
- Thanked 0 Times in 0 Posts
Forecast for EUR/USD on April 20, 2020
EUR/USD
The euro did not dare to make any noticeable decline last Friday, moreover, it even grew by 35 points by preceding to pierce the signal level for selling 1.0830. Now this signal level is moving lower - to the Friday low at the 1.0812 level, overcoming the price opens the way to support the embedded line of the price channel in the region of 1.0610.
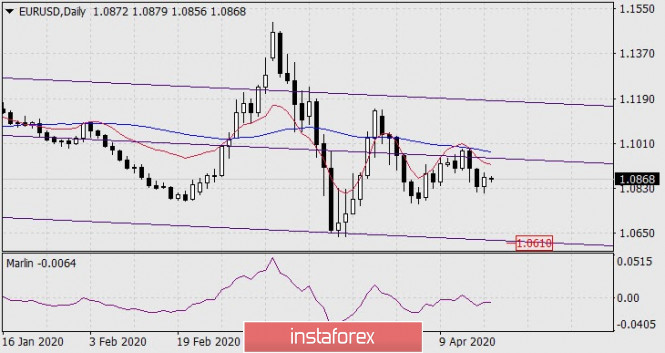
The overall situation of a decline persists on the four-hour chart. The price is developing under both indicator lines - under the line of balance (red) and MACD (blue), the Marlin oscillator in the territory of negative values.
The price increase is limited by the resistance of the MACD line at around 1.0920.
*The market analysis posted here is meant to increase your awareness, but not to give instructions to make a trade.
Analysis are provided byInstaForex.
-
21-04-2020, 07:04 AM #2998Senior Investor
- Join Date
- Aug 2012
- Posts
- 1,942
- Feedback Score
- 0
- Thanks
- 0
- Thanked 0 Times in 0 Posts
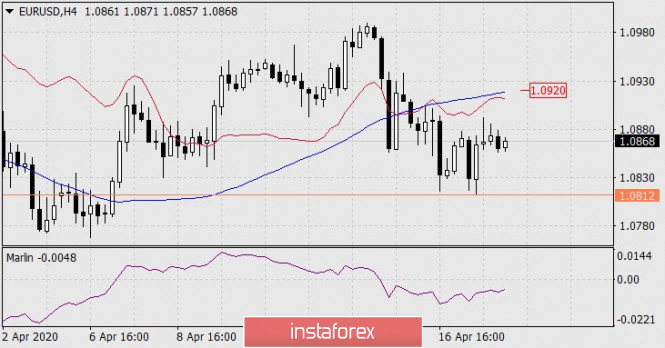
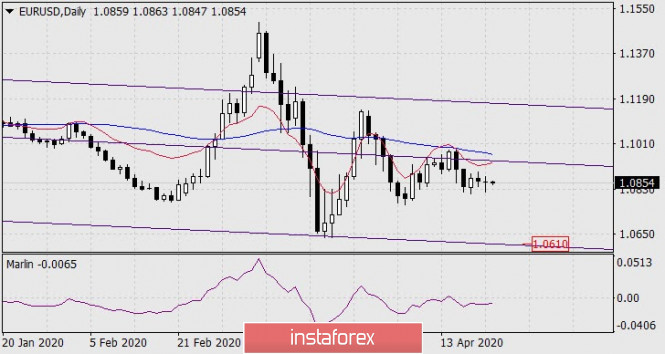
Forecast for EUR/USD for April, 21, 2020
EUR/USD
Oil and US stock indices fell on Monday. Investors again felt fear and continued to buy up the dollar as a safe haven currency. And although the euro fell by only nine points yesterday, fears and uncertainty will continue to dominate the markets for several more days.
The picture remained unchanged on the daily chart - the price is under the indicator lines of balance and MACD, the Marlin oscillator moves horizontally in the negative trend zone. The 1.0610 target for supporting the embedded price channel line of a higher timeframe is maintained.
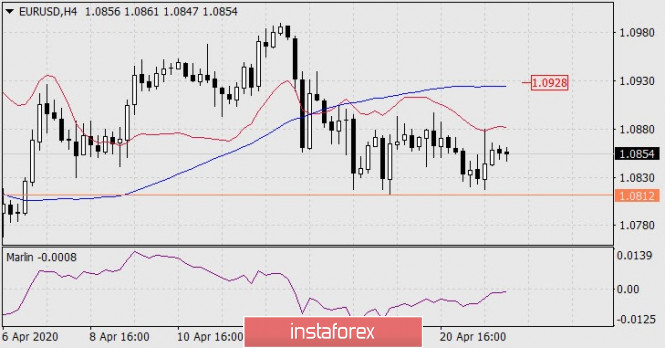
The situation is also unchanged on the four-hour chart, with the only difference being that the indicator lines have started to go down, which strengthened the potential for decline. The final condition for the price to move to 1.0610 will be for the price to overcome Friday's low at 1.0812. Accordingly, short positions can be opened from this level.
An alternative short-term scenario suggests another branch of price growth to the MACD line on the H4 towards the area of 1.0930.
*The market analysis posted here is meant to increase your awareness, but not to give instructions to make a trade.
Analysis are provided byInstaForex.
-
22-04-2020, 07:03 AM #2999Senior Investor
- Join Date
- Aug 2012
- Posts
- 1,942
- Feedback Score
- 0
- Thanks
- 0
- Thanked 0 Times in 0 Posts
Forecast for EUR/USD on April 22, 2020
EUR/USD
There were no changes on the daily euro chart over the past day - the daily fluctuation was 60 points, but the day nearly closed at the opening level. The signal line of the Marlin oscillator moves strictly horizontally in the negative trend zone. The general trend is decreasing, we expect the euro to decline to support the embedded line of the price channel in the region of 1.0610.
The signal line of the Marlin oscillator rose to the border of the growth territory on the four-hour chart over the past day, but the price stopped by the balance indicator line. Therefore, in the current situation, the growth of Marlin is considered as the indicator continuing to discharge before a further decrease.
Nevertheless, the probability of the oscillator moving into a zone of positive values creates a risk of a price increase, possibly even to the MACD line, to the 1.0928 area. A signal of the euro's decisive decline is when the price drops below the low of the 17th (1.0812).
*The market analysis posted here is meant to increase your awareness, but not to give instructions to make a trade.
Analysis are provided byInstaForex.
-
23-04-2020, 07:20 AM #3000Senior Investor
- Join Date
- Aug 2012
- Posts
- 1,942
- Feedback Score
- 0
- Thanks
- 0
- Thanked 0 Times in 0 Posts
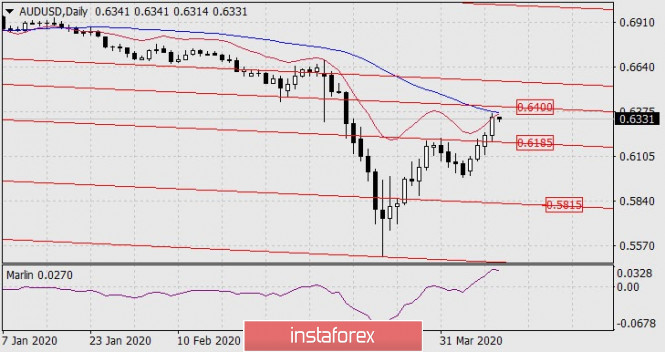
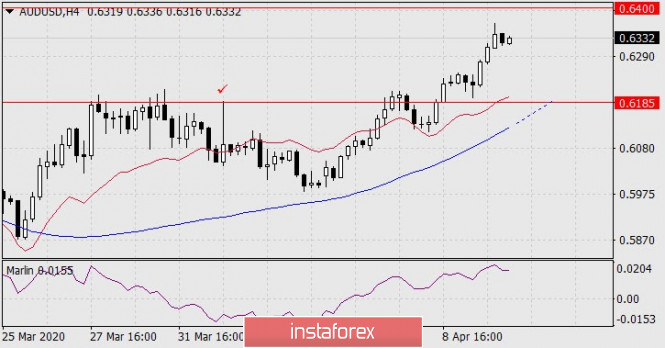
Forecast for AUD/USD on April 23, 2020
AUD/USD The Australian dollar did not consolidate below the MACD indicator line on the daily chart on Wednesday, which delayed the start of the medium-term decline by another 1-2 days. The aussie grew by 42 points. Currently, the price lies on the MACD line, accumulating forces to break through, but growth is possible during this time of consolidation, even to the price channel line in the region of 0.6525, since the price is still above both indicator lines and the Marlin oscillator, albeit falling, remains in the growth zone. Formally, the trend is rising.
When the price overcomes the signal level of 0.6255, this will be a reliable condition for the medium-term decline while aiming for 0.5798 and below. The setup is falling on the H4 chart - the price is below the adaptive balance line (red). The Marlin oscillator could reverse from the boundary of the growth territory. A convergence on Marlin that is not that strong can be worked out.
It is advised to skip the possible price increase, since the reversal can occur from any nearest resistance (0.6380, 0.6446), open sales when the price goes below the signal level of 0.6255.
*The market analysis posted here is meant to increase your awareness, but not to give instructions to make a trade.
Analysis are provided byInstaForex.
-
Sponsored Links


 Reply With Quote
Thread Information
Users Browsing this Thread
There are currently 1 users browsing this thread. (0 members and 1 guests)
 Posting Permissions
24 Hour Gold

Advertising
- Over 20.000 UNIQUE Daily!
- Get Maximum Exposure For Your Site!
- Get QUALITY Converting Traffic!
- Advertise Here Today!
Out Of Billions Of Website's Online.
Members Are Online From.
- Get Maximum Exposure For Your Site!
- Get QUALITY Converting Traffic!
- Advertise Here Today!
Out Of Billions Of Website's Online.
Members Are Online From.


