
 LinkBack URL
 About LinkBacks
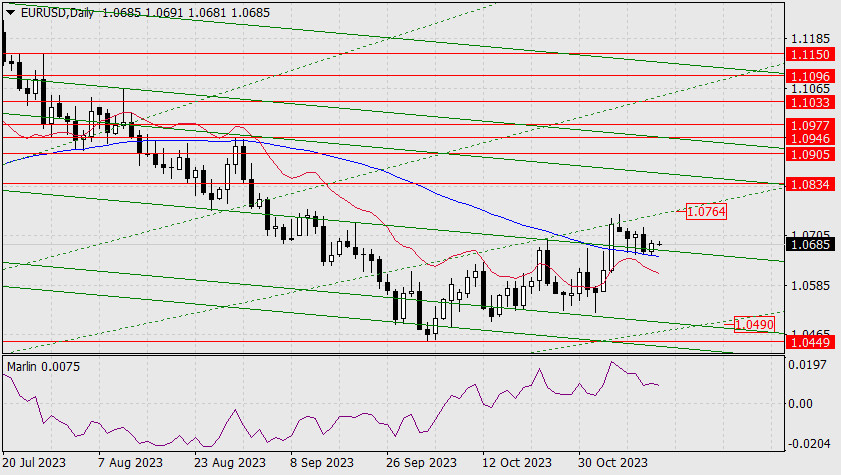
Forecast for EUR/USD on November 13, 2023
On Friday, the euro rebounded for the fourth time from the MACD indicator line with the lower shadow of the daily candle. Visually, the price has risen further, this might be real, which means that the Fibonacci ray is just around 1.0764.
A break above this mark makes it possible for the pair to aim for 1.0834. If the price manages to settle below Friday's low (simultaneously below the MACD line), the euro will head towards the lower Fibonacci ray at around 1.0490.
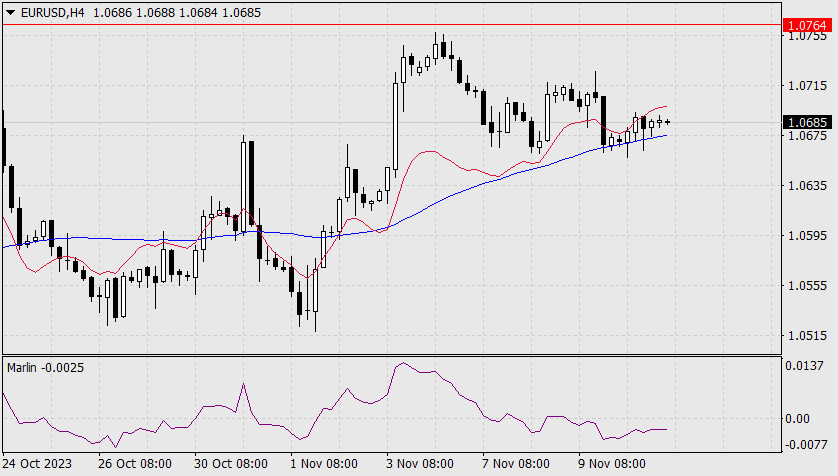
On the 4-hour chart, the price found strong support from the MACD line. The Marlin oscillator is rising, and its signal line is approaching the border of the uptrend territory. Under these conditions, the main scenario is that the price will rise to 1.0764.
Analysis are provided by InstaForex.
Read More
Please visit our sponsors
Results 3,991 to 4,000 of 4086
Thread: InstaForex Wave Analysis
-
13-11-2023, 05:43 AM #3991Senior Investor


- Join Date
- Jun 2012
- Posts
- 3,492
- Feedback Score
- 0
- Thanks
- 0
- Thanked 9 Times in 9 Posts

-
14-11-2023, 07:08 AM #3992Senior Investor
- Join Date
- Jun 2012
- Posts
- 3,492
- Feedback Score
- 0
- Thanks
- 0
- Thanked 9 Times in 9 Posts
AUDUSD H4 I Continue to Support?
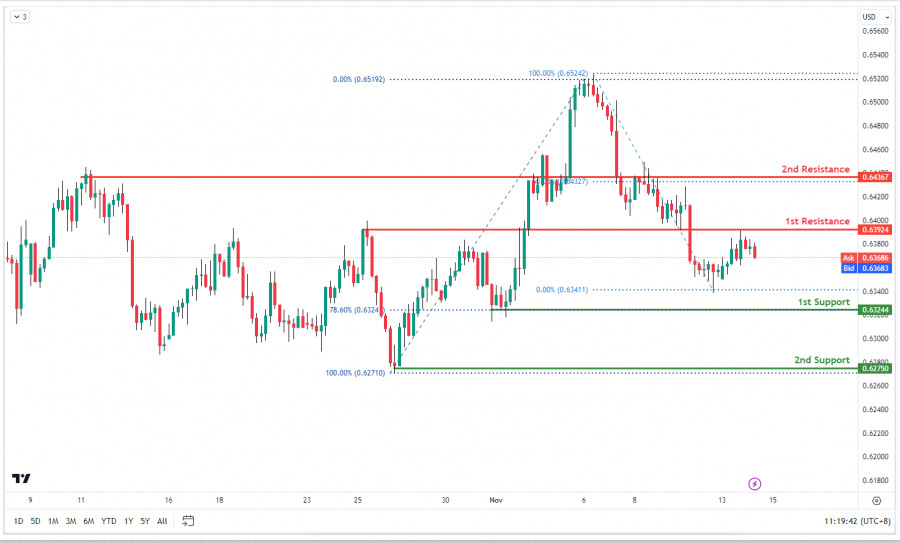
The AUD/USD chart currently shows a bearish momentum with key levels to watch. The 1st support at 0.6324 (overlap and 78.60% Fibonacci Retracement) signifies a historical buying level. The 2nd support at 0.6275 is a swing low support. On the resistance side, the 1st resistance at 0.6392 (overlap) may block further upside, and the 2nd resistance at 0.6436 (50% Fibonacci Retracement) could serve as strong resistance.
Analysis are provided by InstaForex.
Read More
-
15-11-2023, 06:46 AM #3993Senior Investor
- Join Date
- Jun 2012
- Posts
- 3,492
- Feedback Score
- 0
- Thanks
- 0
- Thanked 9 Times in 9 Posts
Forecast for GBP/USD on November 15, 2023
GBP/USD:
After sharply rising on Tuesday, the British pound decided to take a break in the consolidation range of September 7-13 at 1.2447-1.2524. During this pause, the Marlin oscillator's signal line will discharge slightly and then be ready to continue the ascent.
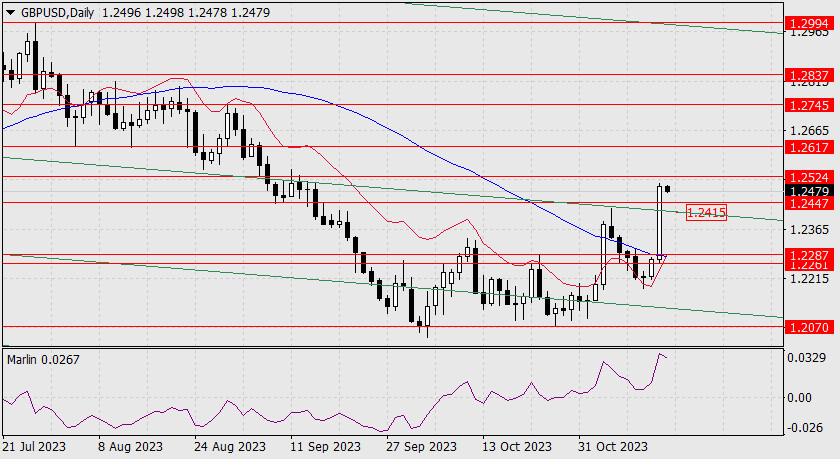
Once the price surpasses 1.2524, the target will be 1.2617. Next is 1.2745, the peak of August 30. If the price falls below the nearest price channel line at 1.2415, it will significantly complicate the correction. The bulls must close above 1.2447.
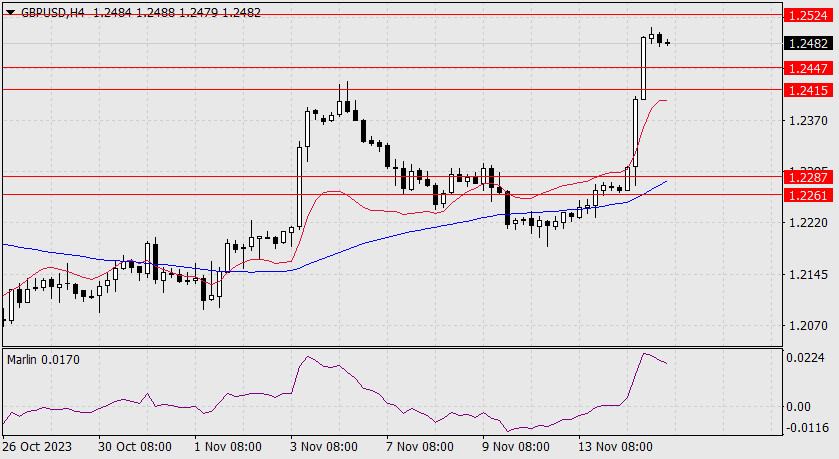
On the 4-hour chart, the correction is also looming. The Marlin oscillator's signal line sharply turned down, but apparently, this was so that the price would not fall below the critical support after the oscillator. After a consolidation, we expect the price to continue rising.
Analysis are provided by InstaForex.
Read More
-
16-11-2023, 06:21 AM #3994Senior Investor
- Join Date
- Jun 2012
- Posts
- 3,492
- Feedback Score
- 0
- Thanks
- 0
- Thanked 9 Times in 9 Posts
Analysis of Gold for November 16, 2023 - Key resistance cluster on the test
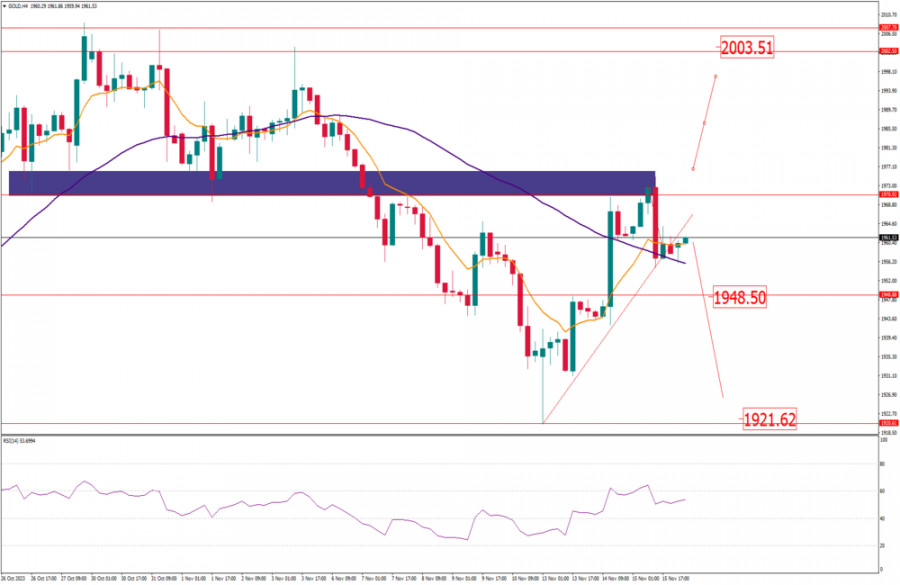
Gold has been trading sideways at the price of $1.961 but I found that key resistance sat the prie of $1.970 is on the test.
In case of the rejection of the key resistance cluster, I see potetnial for the further downside movement towards lower references at $1.948 and $1.921.
In case of the upside breakout of the resistance cluster and hold above, there is the chance for the rally towards $2.003
RSI oscillator is showing reading above 50, which is sign that buyers are in control.
Analysis are provided by InstaForex.
Read More
-
17-11-2023, 05:16 AM #3995Senior Investor
- Join Date
- Jun 2012
- Posts
- 3,492
- Feedback Score
- 0
- Thanks
- 0
- Thanked 9 Times in 9 Posts
Forecast for USD/JPY on November 17, 2023
USD/JPY:
On the daily chart, the yen is coiling around the price channel line within a wide range but has not been able to settle above or below this line. Let's see if the price can do this today. If it consolidates below the price channel line, the price will try to challenge the support levels at 150.00 and the MACD line at 149.65. Overcoming the MACD line not only opens up the nearest target at 148.18 but also paves the way for a decline in the medium-term (140.93).
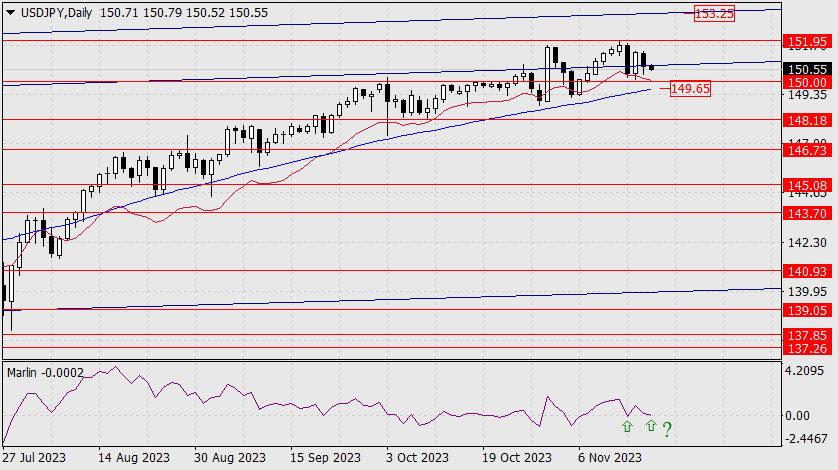
A day closing with a white candle, followed by Monday's close above the price channel line, provides the opportunity to overcome the target level of 151.95 and the price can rise to 153.25. This scenario does not look weak, as the Marlin oscillator is ready to repeat the bullish reversal from the zero line.
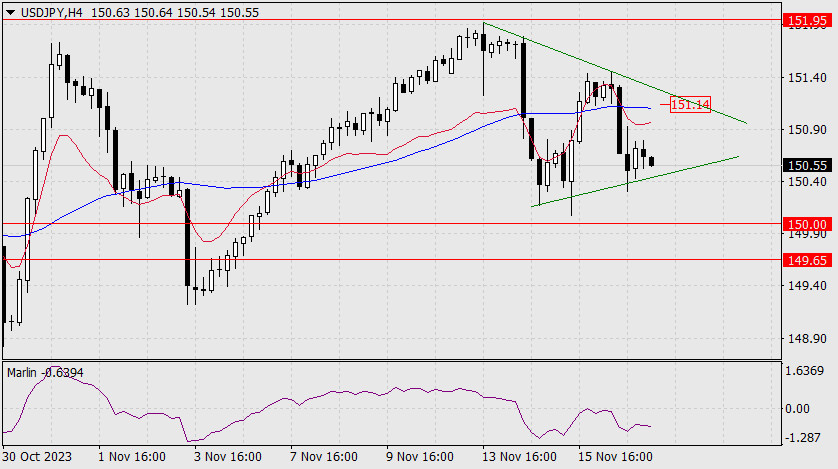
On the 4-hour chart, the price is forming a triangle pattern. If this is a triangle, we can expect at least one more upward movement. If this is not a potential triangle, a bearish breakout may follow. Also, take note that the price is progressing below both indicator lines, and the Marlin oscillator is in the bearish territory. Keep an eye on the price's behavior at the levels of 150.00 and 149.65.
Analysis are provided by InstaForex.
Read More
-
20-11-2023, 05:10 AM #3996Senior Investor
- Join Date
- Jun 2012
- Posts
- 3,492
- Feedback Score
- 0
- Thanks
- 0
- Thanked 9 Times in 9 Posts
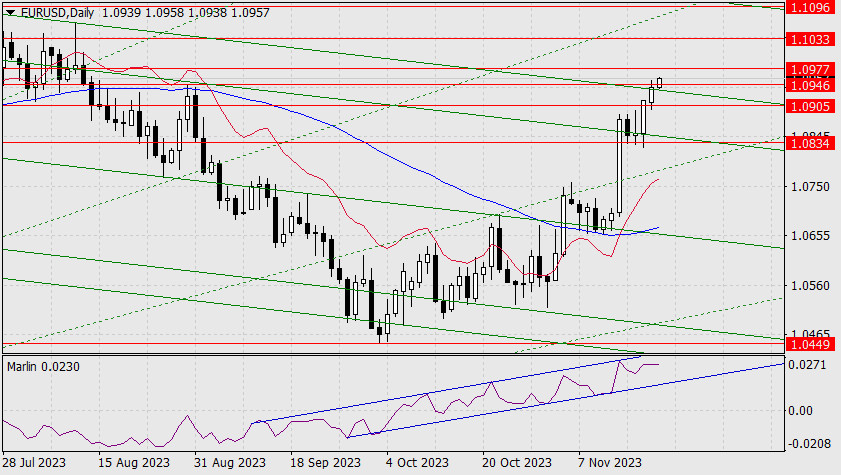
Forecast for EUR/USD on November 20, 2023
EUR/USD:
After fluctuating for some time, the euro rose on Friday, gaining more than 60 pips. It reached the target level of 1.0905. The signal line of the Marlin oscillator is turning upward towards the upper band of the ascending channel.
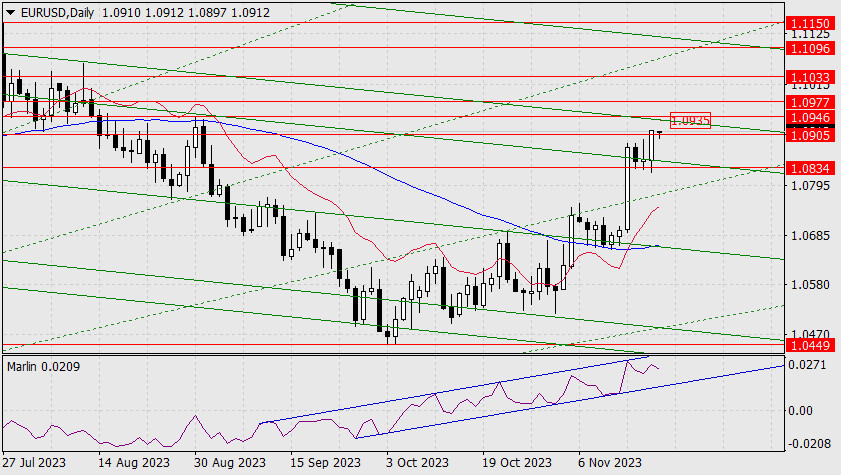
There is a high probability of a synchronous downward reversal of the Marlin oscillator from both the channel's boundary and the price from any target level (1.0946, 1.0977). Today, the price has been falling, so the pair can only show a stable upward movement if the price returns above 1.0905.
On the 4-hour chart, the price is rising, slightly pausing at 1.0905. But the potential divergence, when it forms, will indicate a more significant corrective decline.
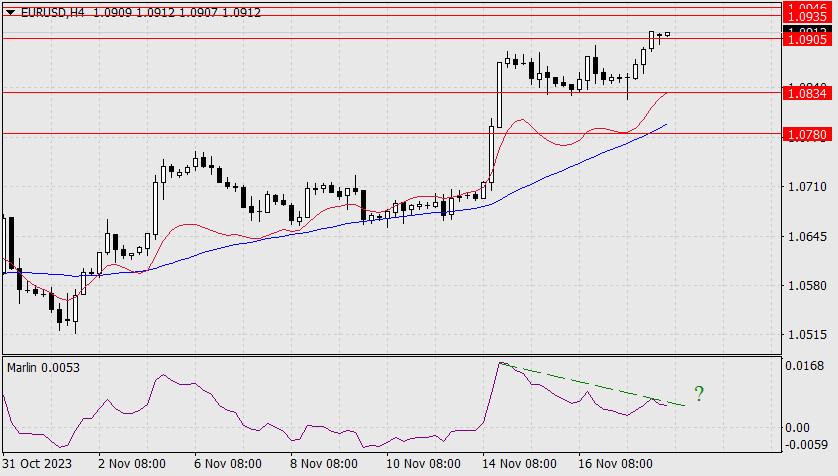
Once the correction ends, we expect the price to continue rising towards the level of 1.1096, considering the intermediate resistances at 1.0935/46, 1.0977, 1.1033.
Analysis are provided by InstaForex.
Read More
-
21-11-2023, 07:31 AM #3997Senior Investor
- Join Date
- Jun 2012
- Posts
- 3,492
- Feedback Score
- 0
- Thanks
- 0
- Thanked 9 Times in 9 Posts
Forecast for EUR/USD on November 21, 2023
EUR/USD
Yesterday, the euro reached the 2-year descending price channel line and the target level of 1.0946. This morning, the price is trying to break above this level towards the nearest target at 1.0977. Once the price surpasses this mark, the next target will be 1.1033 (January peak).
The Marlin oscillator is not in a hurry to rise along with the price, so the risk of a corrective decline increases with each day. Overall, we expect the signal line of the oscillator to be tested at the upper band of the ascending channel.
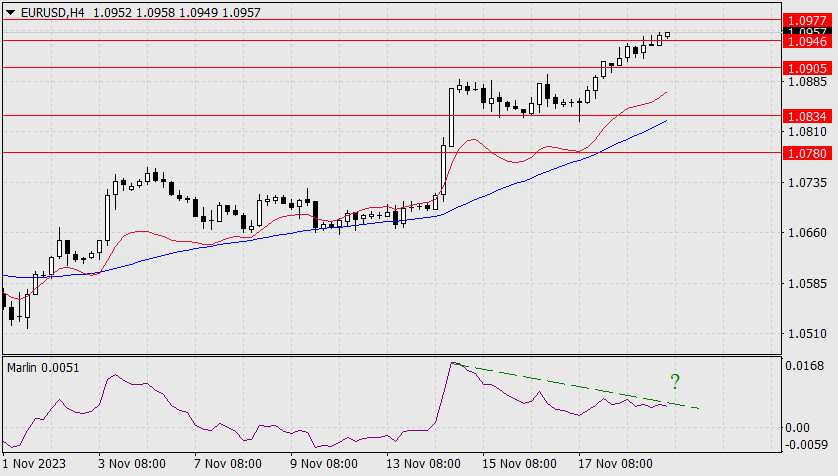
On the 4-hour chart, the price is breaking above the resistance of 1.0946 with a desire to consolidate above it. The Marlin oscillator is turning upward, creating a risk of divergence with the price. However, the reversal is not characteristic of a divergence, so the upward movement has the advantage at the moment.
Analysis are provided by InstaForex.
Read More
-
22-11-2023, 09:00 AM #3998Senior Investor
- Join Date
- Jun 2012
- Posts
- 3,492
- Feedback Score
- 0
- Thanks
- 0
- Thanked 9 Times in 9 Posts
Technical Analysis of Intraday Price Movement of Gold Commodity Asset, Wednesday, November 22 2023
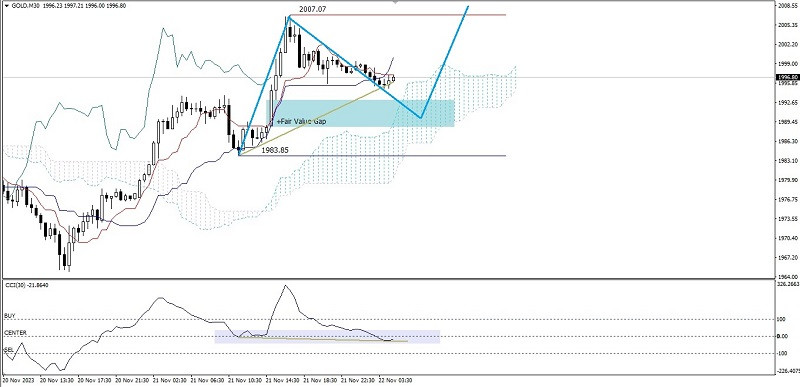
On the 30 minutes chart of Gold commodity asset, there is the price movement which is above the Kumo, Chikou Span also above the price and Kumo and even though Tenkan Sen and Kinjun Sen above the Kumo, but intersect with the Death Cross, which means although the Gold is in the Bullish condition, but in the near future has the potential to corrected below, where this is also confirmed by the appearance of the hidden deviation between price movement with CCI indicator so that, in the near future Gold has the potential to corrected downward, but if the weakness doesn't exceed under the level 1988,80, then Gold has the potential to be strong again up to the level 2007,07.
Analysis are provided by InstaForex.
Read More
-
23-11-2023, 05:08 AM #3999Senior Investor
- Join Date
- Jun 2012
- Posts
- 3,492
- Feedback Score
- 0
- Thanks
- 0
- Thanked 9 Times in 9 Posts
Forex Analysis & Reviews: Hot forecast for EUR/USD on November 22, 2023
Market trends do not unfold continuously as periodic pullbacks could happen. That is exactly what happened yesterday, despite the extremely weak data on existing home sales in the US, which fell by 4.1%, and has been decreasing for five consecutive months, with a total reduction of 11.9%.
At the beginning of the year, US home sales declined by 6.0%, but in February, it improved slightly, showing a 13.8% increase. Even so, the cumulative decrease is quite significant, naturally not inspiring any optimism. This should have resulted in dollar weakening, but pound fell instead.
The Fed's hawkish stance on monetary policy could not be the reason as the meeting took place before the sharp slowdown in inflation became known. Most likely, the movement is a technical rebound, which means that dollar will show its expected decline soon, especially since today, data on durable goods orders will be published. The figure is expected to fall by 2.8%. The potential 5,000 increase in jobless claims may also spark further dollar weakening.
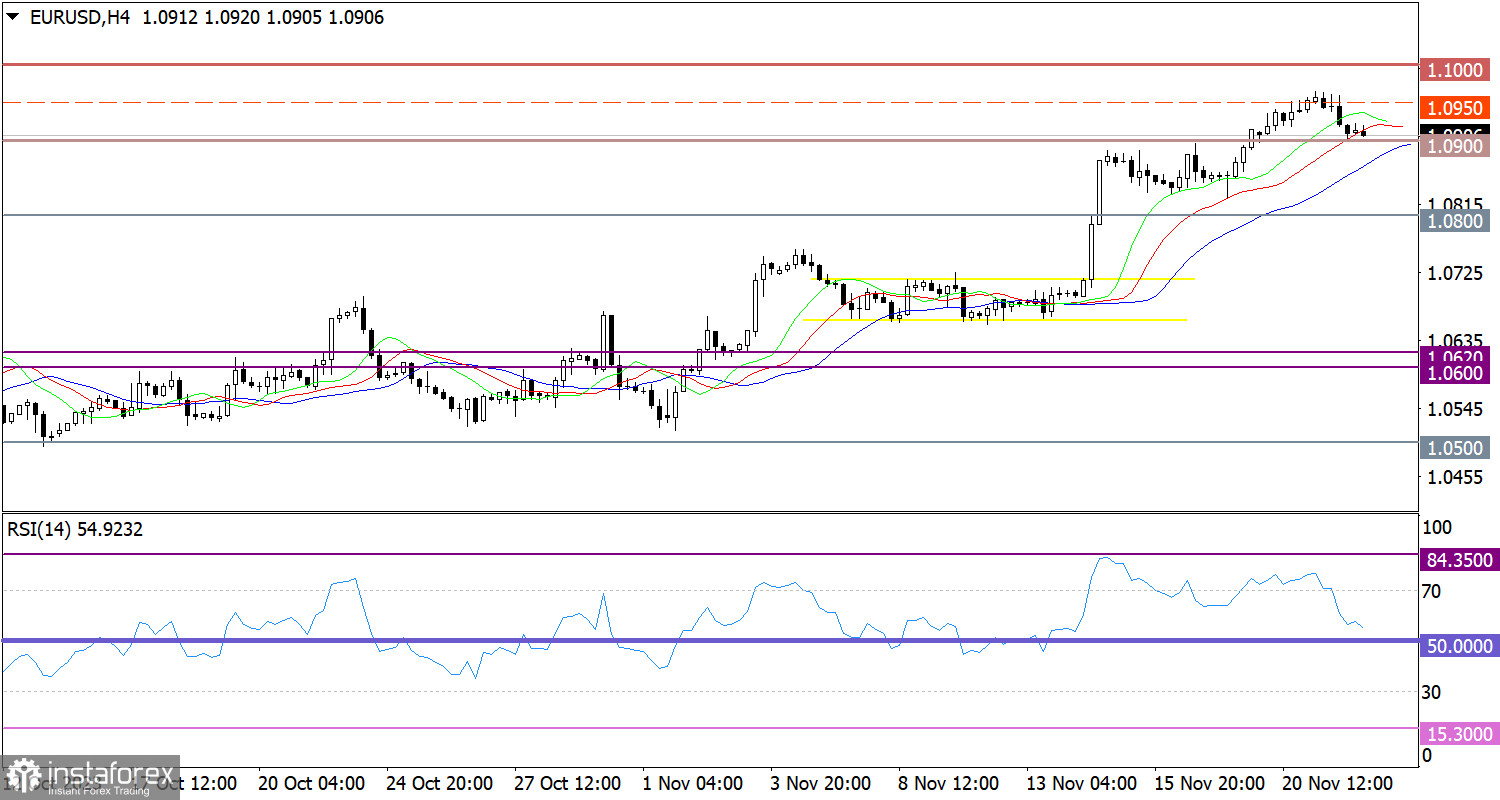
EUR/USD hit the lower range of the psychological level of 1.0950/1.1000, resulting in a decrease in the volume of long positions. This led to a pullback, which may also be due to the overbought condition of euro.
Looking at the RSI H4, there is an exit from the overbought area due to the pullback.
In the daily period, the indicator is moving near the 70 zone.
As for the Alligator H4 indicator, it ignored the pullback, with the moving MA lines pointing upwards.
Outlook
For further decline, traders need to keep the price below 1.0900, as that will spark a complete correction. Alternatively, there could be a decrease in the volume of short positions around the level of 1.0900, treating it as support. In this scenario, there will be another attempt to break the psychological level of 1.1000.
The complex indicator analysis points to an upward cycle in the short-term, medium-term and intraday periods.
Analysis are provided byInstaForex.
Read More
-
23-11-2023, 05:45 AM #4000Senior Investor
- Join Date
- Jun 2012
- Posts
- 3,492
- Feedback Score
- 0
- Thanks
- 0
- Thanked 9 Times in 9 Posts
Forex Analysis & Reviews: Forecast for GBP/USD on November 23, 2023
GBP/USD:
Yesterday, the low was 1.2448, which is approximately the trough since September 7th. In general, the support is not weak, as the price lingered on this mark for five days since September. Now the price could break above the level of 1.2524. If the price stays above this mark, the next target could be 1.2645. The brewing divergence between the price and the Marlin oscillator is losing its strength.
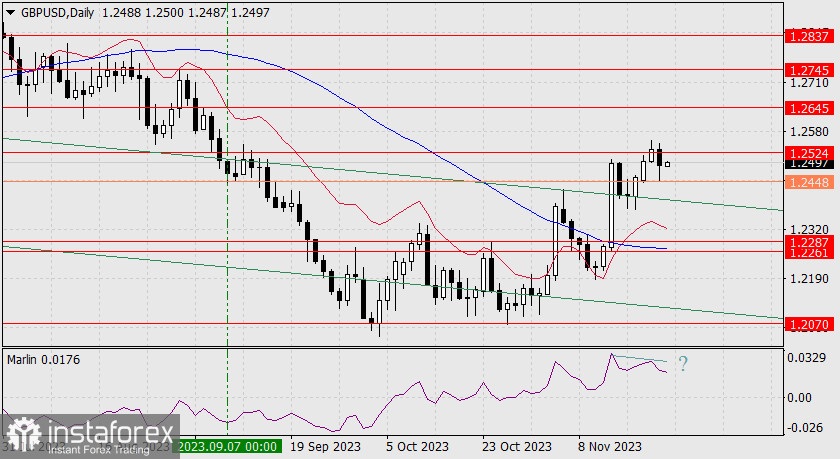
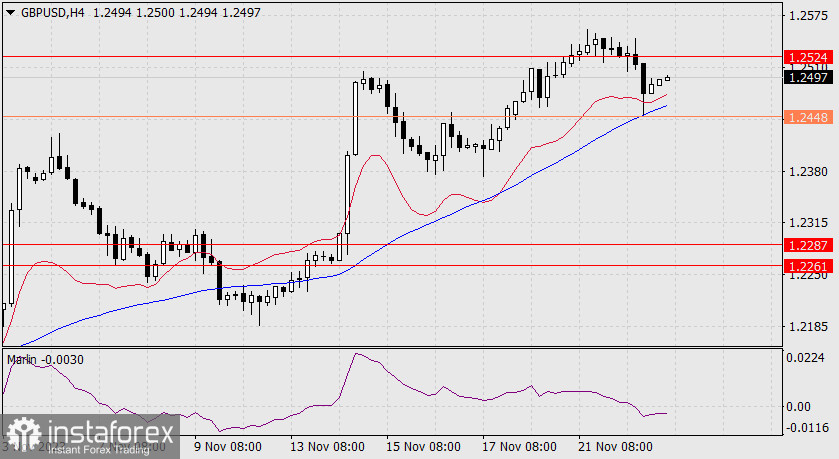
Now the signal line of the oscillator takes on a wedge shape. We could witness a bullish breakout from the wedge. On the 4-hour chart, the price turned up from the MACD line. The Marlin oscillator has already moved to the bearish territory, so the price may linger a bit before the resistance at 1.2524.
The UK Manufacturing PMI for November, which will be released today, is forecasted to rise from 44.8 to 45.0. Therefore, the pound has the opportunity to rise, even if it the United States is celebrating a holiday today.
Analysis are provided byInstaForex.
Read More
-
Sponsored Links


 Reply With Quote
Thread Information
Users Browsing this Thread
There are currently 1 users browsing this thread. (0 members and 1 guests)
 Posting Permissions
24 Hour Gold

Advertising
- Over 20.000 UNIQUE Daily!
- Get Maximum Exposure For Your Site!
- Get QUALITY Converting Traffic!
- Advertise Here Today!
Out Of Billions Of Website's Online.
Members Are Online From.
- Get Maximum Exposure For Your Site!
- Get QUALITY Converting Traffic!
- Advertise Here Today!
Out Of Billions Of Website's Online.
Members Are Online From.


