
 LinkBack URL
 About LinkBacks
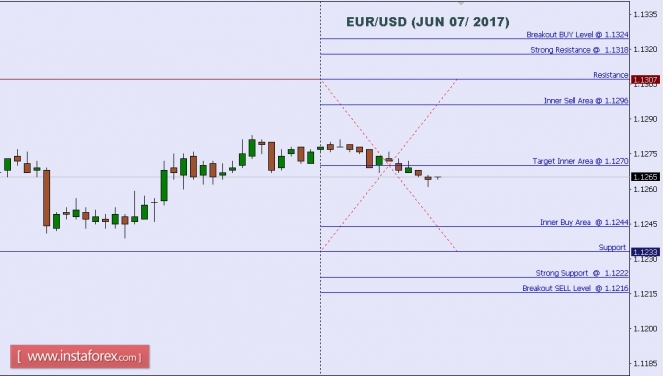
Technical analysis of EUR/USD for June 07, 2017
When the European market opens, some Economic Data will be released, such as Italian Retail Sales m/m and German Factory Orders m/m. The US will release the Economic Data, too, such as Consumer Credit m/m and Crude Oil Inventories, so, amid the reports, EUR/USD will move in a low to medium volatility during this day.
TODAY'S TECHNICAL LEVEL:
Breakout BUY Level: 1.1324.
Strong Resistance:1.1318.
Original Resistance: 1.1307.
Inner Sell Area: 1.1296.
Target Inner Area: 1.1270.
Inner Buy Area: 1.1244.
Original Support: 1.1233.
Strong Support: 1.1222.
Breakout SELL Level: 1.1216.
Analysis are provided byInstaForex.
Please visit our sponsors
Results 2,321 to 2,330 of 4086
Thread: InstaForex Wave Analysis
-
07-06-2017, 06:05 AM #2321Senior Investor


- Join Date
- Aug 2012
- Posts
- 1,942
- Feedback Score
- 0
- Thanks
- 0
- Thanked 0 Times in 0 Posts

-
08-06-2017, 06:38 AM #2322Senior Investor
- Join Date
- Aug 2012
- Posts
- 1,942
- Feedback Score
- 0
- Thanks
- 0
- Thanked 0 Times in 0 Posts
Technical analysis of EUR/USD for June 08, 2017
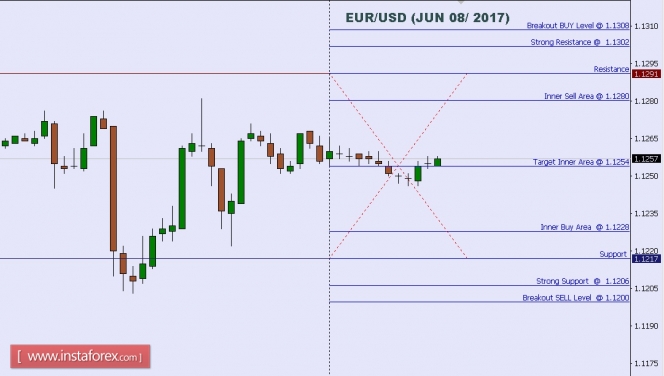
When the European market opens, some Economic Data will be released, such as Minimum Bid Rate, Revised GDP q/q, French Trade Balance, and German Industrial Production m/m. The US will release the Economic Data, too, such as Natural Gas Storage, and Unemployment Claims, so, amid the reports, EUR/USD will move in a low to medium volatility during this day.
TODAY'S TECHNICAL LEVEL:
Breakout BUY Level: 1.1308.
Strong Resistance:1.1302.
Original Resistance: 1.1291.
Inner Sell Area: 1.1280.
Target Inner Area: 1.1254.
Inner Buy Area: 1.1228.
Original Support: 1.1217.
Strong Support: 1.1206.
Breakout SELL Level: 1.1200.
Analysis are provided byInstaForex.
-
09-06-2017, 06:30 AM #2323Senior Investor
- Join Date
- Aug 2012
- Posts
- 1,942
- Feedback Score
- 0
- Thanks
- 0
- Thanked 0 Times in 0 Posts
Elliott wave analysis of EUR/NZD for June 9, 2017
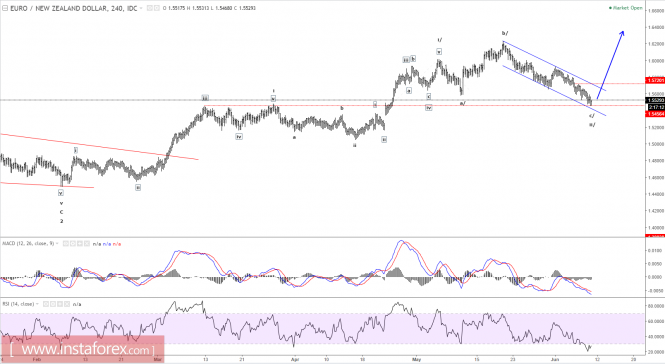
Wave summary:
Wave ii/ has extended it's decline to 1.5468, which should be more than enough to complete wave ii/ and set the stage for a rally higher in wave iii/ towards 1.6655.
That said, we will need a break above minor resistance seen at 1.5720 to confirm that wave ii/ has completed and wave iii/ is developing.
R3: 1.5720
R2: 1.5667
R1: 1.5594
Pivot: 1.5525
S1: 1.5462
S2: 1.5391
S3: 1.5342
Trading recommendation:
WE are long EUR from 1.5540 and will place our stop at 1.5340.
Analysis are provided byInstaForex.
-
13-06-2017, 07:45 AM #2324Senior Investor
- Join Date
- Aug 2012
- Posts
- 1,942
- Feedback Score
- 0
- Thanks
- 0
- Thanked 0 Times in 0 Posts
Elliott wave analysis of EUR/NZD for June 13, 2017
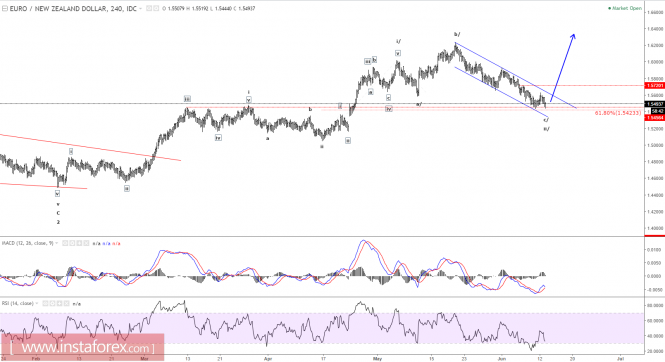
Wave summary:
We continue to look for confirmation that the corrective decline from 1.6237 has completed. The first strong indication will be a break above the resistance line seen at 1.5636, while a break above resistance at 1.5720 will add confidence in wave iii/ developing towards 1.6655.
R3: 1.5931
R2: 1.5720
R1: 1.5636
Pivot: 1.5600
S1: 1.5491
S2: 1.5439
S3: 1.5369
Trading recommendation:
We are long EUR from 1.5540 with stop placed at 1.5340. If you are not long EUR yet, then buy a break above 1.5636 and use the same stop.
Analysis are provided byInstaForex.
-
14-06-2017, 07:33 AM #2325Senior Investor
- Join Date
- Aug 2012
- Posts
- 1,942
- Feedback Score
- 0
- Thanks
- 0
- Thanked 0 Times in 0 Posts
Elliott wave analysis of EUR/JPY for June 14, 2017
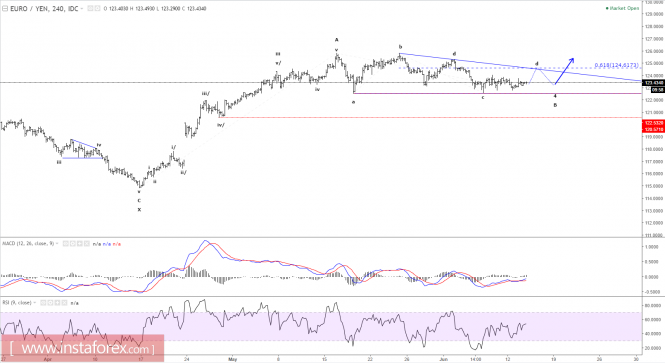
Wave summary:
Not really much to add here. The triangle consolidation remains the preferred outlook. We continue to look for wave d closer to 134.62 before the final dip lower in wave e to complete the triangle consolidation, setting the stage for renewed upside pressure towards 134.58 and likely even closer to 138.52.
Only an unexpected break below 122.53 will shift to an alternate corrective structure.
R3: 124.04
R2: 123.73
R1: 123.40
Pivot: 123.20
S1: 123.00
S2: 122.77
S3: 122.53
Trading recommendation:
We are neutral for now.
Analysis are provided byInstaForex.
-
15-06-2017, 06:59 AM #2326Senior Investor
- Join Date
- Aug 2012
- Posts
- 1,942
- Feedback Score
- 0
- Thanks
- 0
- Thanked 0 Times in 0 Posts
Technical analysis of USD/JPY for June 15, 2017
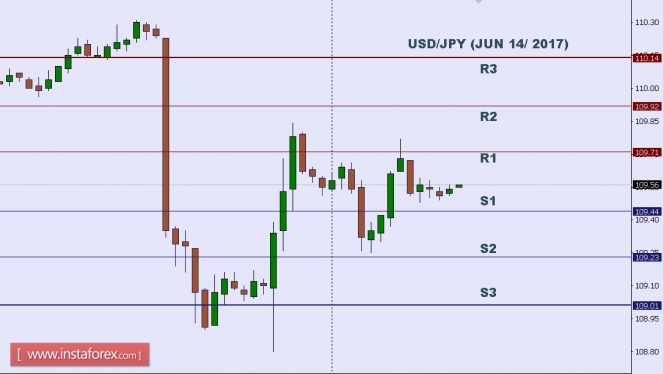
In Asia, Japan today will not release any Economic Data, but the US will release some Economic Data, such as TIC Long-Term Purchases, Natural Gas Storage, NAHB Housing Market Index, Industrial Production m/m, Capacity Utilization Rate, Philly Fed Manufacturing Index, Import Prices m/m, Empire State Manufacturing Index, and Unemployment Claims. So, there is a probability the USD/JPY will move with low to medium volatility during this day.
TODAY'S TECHNICAL LEVEL:
Resistance. 3: 110.14.
Resistance. 2: 109.92.
Resistance. 1: 109.71.
Support. 1: 109.44.
Support. 2: 109.23.
Support. 3: 109.01.
Analysis are provided byInstaForex.
-
15-06-2017, 08:55 AM #2327Senior Investor
- Join Date
- Feb 2017
- Posts
- 590
- Feedback Score
- 0
- Thanks
- 0
- Thanked 0 Times in 0 Posts
Each and every broker proves signal for the welfare of their traders. It is counted as the extra facility provided by broker. Every broker has their own analyzers and so does Trade12. This broker provides signals on daily basis. I use to follow their signal and economic calendar. I have changed many brokers in my career. But now I am happy with the broker. This is really a flawless broker from each and every sights.
-
16-06-2017, 08:05 AM #2328Senior Investor
- Join Date
- Aug 2012
- Posts
- 1,942
- Feedback Score
- 0
- Thanks
- 0
- Thanked 0 Times in 0 Posts
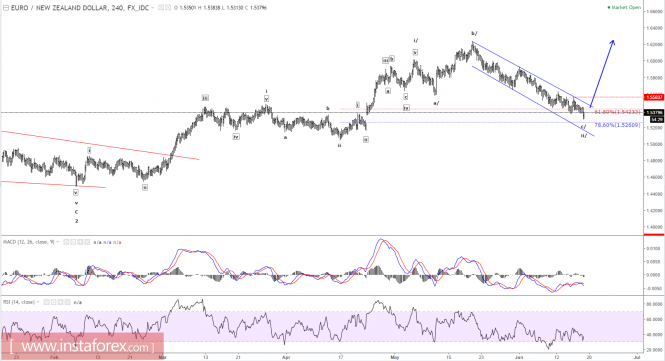
Elliott wave analysis of EUR/NZD for June 16, 2017
Wave summary:
Our preferred count remains that a low likely was seen with the test of 1.5370 and wave iii/ higher is ready to develop. That said, we need a break above the resistance line near 1.5532 to confirm that wave ii/ has completed and wave iii/ higher to above 1.6237 is developing. Until the break above the resistance-line near 1.5532 is seen, we must allow for a retest of the 1.5370 low and even a spike below, but that should be short lived.
R3: 1.5564
R2: 1.5517
R1: 1.5480
Pivot: 1.5460
S1: 1.5453
S2: 1.5424
S3. 1.5370
Trading recommendation:
We are long EUR from 1.5540 with stop placed at 1.5340. If you are not long EUR yet, then buy a break above 1.5532 and use the same stop.
Analysis are provided byInstaForex.
-
19-06-2017, 07:33 AM #2329Senior Investor
- Join Date
- Aug 2012
- Posts
- 1,942
- Feedback Score
- 0
- Thanks
- 0
- Thanked 0 Times in 0 Posts
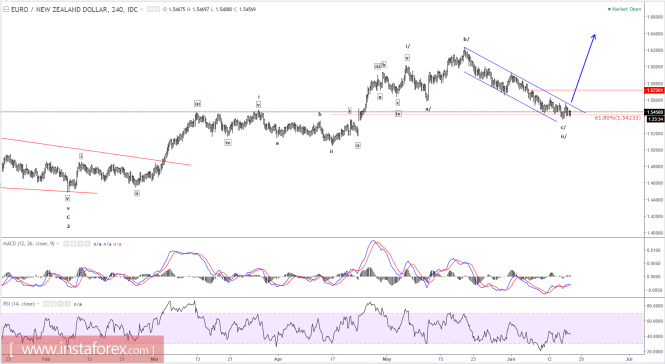
Elliott wave analysis of EUR/NZD for June 19, 2017
Wave summary:
The corrective decline in wave ii/ will not loosen its grip and it has now spiked below support at 1.5423, this opens for more downside pressure towards 1.5261 as long as the resistance line near 1.5500 and more importantly as long minor resistance at 1.5564 is able to cap the upside. However, a break above this resistance will indicate that wave ii/ has completed and wave iii/ towards 1.6655 is developing.
R3: 1.5544
R2: 1.5485
R1: 1.5415
Pivot: 1.5400
S1: 1.5347
S2: 1.5300
S3: 1.5261
Trading recommendation:
Our stop was hit for a loss. We will only buy a break above 1.5564.
Analysis are provided byInstaForex.
-
20-06-2017, 06:51 AM #2330Senior Investor
- Join Date
- Aug 2012
- Posts
- 1,942
- Feedback Score
- 0
- Thanks
- 0
- Thanked 0 Times in 0 Posts
Daily analysis of USDX for June 20, 2017
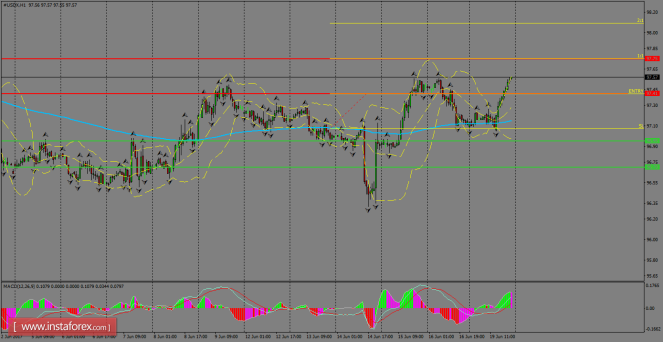
USDX was favored by the bulls above the 200 SMA at H1 chart and it's heading to break above last Friday's highs. If that happens, we can expect a target to be reached around 97.75, which should add strength to bulls' force in the short-term. By the other side, if the index pulls back at the current stage, then a testing of the 96.95 level is likely to happen.
H1 chart's resistance levels: 97.41 / 97.75
H1 chart's support levels: 96.95 / 96.70
Trading recommendations for today:
Based on the H1 chart, place buy (long) orders only if the USD Index breaks with a bullish candlestick; the resistance level is at 97.41, take profit is at 97.75 and stop loss is at 97.07.
Analysis are provided byInstaForex.
-
Sponsored Links


 Reply With Quote
Thread Information
Users Browsing this Thread
There are currently 1 users browsing this thread. (0 members and 1 guests)
 Posting Permissions
24 Hour Gold

Advertising
- Over 20.000 UNIQUE Daily!
- Get Maximum Exposure For Your Site!
- Get QUALITY Converting Traffic!
- Advertise Here Today!
Out Of Billions Of Website's Online.
Members Are Online From.
- Get Maximum Exposure For Your Site!
- Get QUALITY Converting Traffic!
- Advertise Here Today!
Out Of Billions Of Website's Online.
Members Are Online From.


