
 LinkBack URL
 About LinkBacks
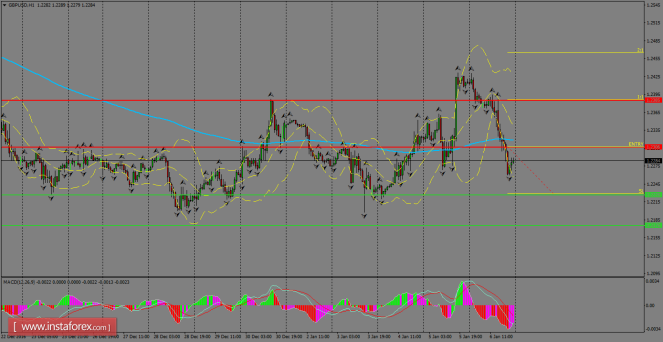
Daily analysis of GBP/USD for January 09, 2017
Friday was very volatile for USD-related pairs and in the case of the Sterling, GBP/USD weakened across the board to consolidate below the 200 SMA at H1 chart. The next target to the downside is located around 1.2226, where a demand zone is placed and it could help to bring some bulls force to push higher the pair. If GBP/USD gets back to the previous trend, it should break the resistance level of 1.2306 to reach the area of 1.2385.
H1 chart's resistance levels: 1.2306 / 1.2385
H1 chart's support levels: 1.2226 / 1.2176
Trading recommendations for today: Based on the H1 chart, buy (long) orders only if the GBP/USD pair breaks a bullish candlestick; the resistance level is at 1.2306, take profit is at 1.2385 and stop loss is at 1.2228.
More analysis - at instaforex.com
Please visit our sponsors
Results 2,221 to 2,230 of 4086
Thread: InstaForex Wave Analysis
-
09-01-2017, 07:40 AM #2221Senior Investor


- Join Date
- Jun 2012
- Posts
- 3,492
- Feedback Score
- 0
- Thanks
- 0
- Thanked 9 Times in 9 Posts

-
10-01-2017, 07:50 AM #2222Senior Investor
- Join Date
- Jun 2012
- Posts
- 3,492
- Feedback Score
- 0
- Thanks
- 0
- Thanked 9 Times in 9 Posts
USD/CAD intraday technical levels and trading recommendations for January 10, 2017
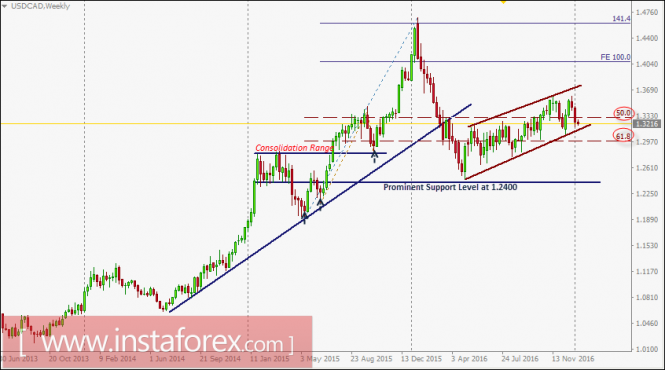
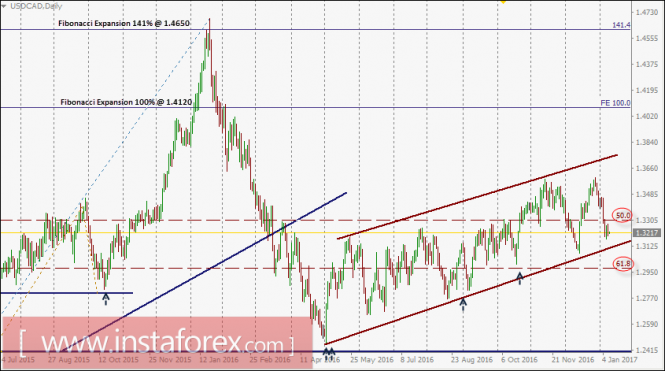
On August 18, signs of bullish recovery were manifested around the price level of 1.2830 which led to the current bullish breakout above 1.3000.
The USD/CAD pair was trapped between the price levels of 1.3000 (61.8% Fibonacci level) and 1.3360 (50% Fibonacci level) until a bullish breakout took place one month ago.
Note that the USD/CAD pair challenged the upper limit of the depicted channel around 1.3360-1.3400 which succeeded to apply enough bearish pressure on the pair.
Shortly after, a bearish engulfing weekly candlestick was expressed by the end of the week indicating strong resistance around 1.3550.
Bearish persistence below the price level of 1.3300 (50% Fibonacci Level) was achieved. This allowed a further decline toward 1.3200 and 1.3080 (the lower limit of the depicted channel) where bullish rejection was expressed as anticipated.
A bullish breakout above 1.3360 (50% Fibonacci level) allows a bullish movement toward 1.3700-1.3750 (the upper limit of the depicted channel) where bearish rejection should be expected.
On the other hand, the current bearish pullback toward 1.3300 - 1.3250 (50% Fibonacci Level) should be watched for bullish rejection and a possible BUY entry. S/L should be placed below 1.3170.
More analysis - at instaforex.com
-
11-01-2017, 07:11 AM #2223Senior Investor
- Join Date
- Jun 2012
- Posts
- 3,492
- Feedback Score
- 0
- Thanks
- 0
- Thanked 9 Times in 9 Posts
Technical analysis of EUR/USD for Jan 11, 2017
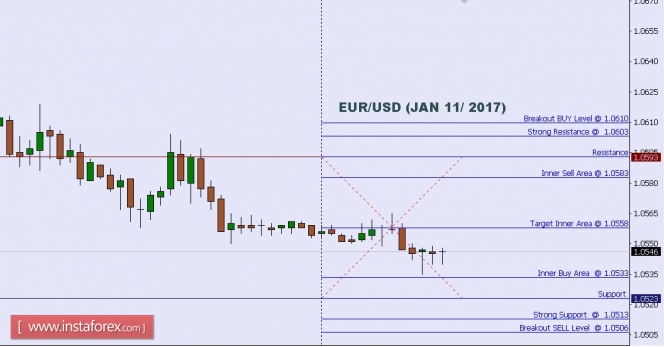
When the European market opens, some Economic Data will be released, such as German 10-y Bond Auction. The US will release the economic data, too, such as 10-y Bond Auction and Crude Oil Inventories, so, amid the reports, EUR/USD will move in a low to medium volatility during this day.
TODAY'S TECHNICAL LEVEL:
Breakout BUY Level: 1.0610.
Strong Resistance:1.0603.
Original Resistance: 1.0593.
Inner Sell Area: 1.0583.
Target Inner Area: 1.0558.
Inner Buy Area: 1.0533.
Original Support: 1.0523.
Strong Support: 1.0513.
Breakout SELL Level: 1.0506.
More analysis - at instaforex.com
-
12-01-2017, 08:21 AM #2224Senior Investor
- Join Date
- Jun 2012
- Posts
- 3,492
- Feedback Score
- 0
- Thanks
- 0
- Thanked 9 Times in 9 Posts
Technical analysis of USD/CHF for January 12, 2017
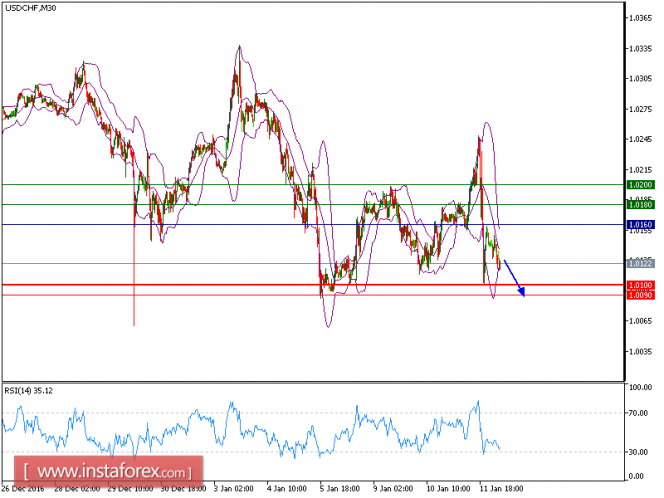
USD/CHF is under pressure. The pair broke below its 20-period and 50-period moving averages and is consolidated on the downside. The declining 20-period moving average crossed below the 50-period one, which is negative. The relative strength index is below its neutrality level at 50 and lacks upward momentum.
The U.S. dollar turned to the downside in a volatile session as traders found that Trump offered little clarity on economic stimulus plans during his closely watched news conference. The ICE U.S. Dollar Index surged up to 102.95 before the news conference but reversed course and dived to 101.28, its lowest intraday level since December 14, before settling at 101.78, down 0.2% on day.
As long as 1.0160 is resistance, look for a further drop toward 1.0110 and even 1.0090 in extension.
Resistance levels: 1.0180, 1.0200, 1.0220
Support levels: 1.0100, 1.0090, 1.0055
More analysis - at instaforex.com
-
13-01-2017, 07:51 AM #2225Senior Investor
- Join Date
- Jun 2012
- Posts
- 3,492
- Feedback Score
- 0
- Thanks
- 0
- Thanked 9 Times in 9 Posts
Technical analysis of EUR/USD for Jan 13, 2017
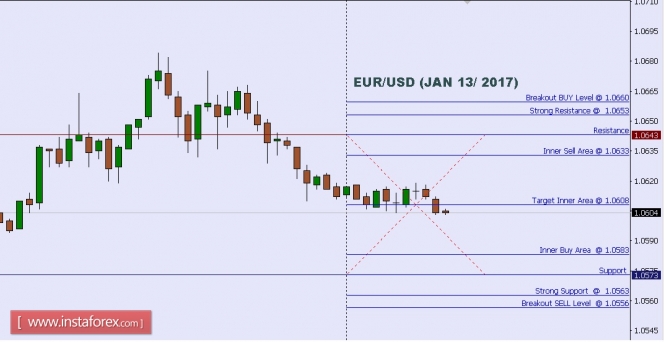
When the European market opens, there is no Economic Data will be, but the US will release the economic data, such as Federal Budget Balance, Prelim UoM Inflation Expectations, Business Inventories m/m, Prelim UoM Consumer Sentiment, Core PPI m/m, Retail Sales m/m, PPI m/m and Core Retail Sales m/m, so, amid the reports, EUR/USD will move in a low to medium volatility during this day.
TODAY'S TECHNICAL LEVEL:
Breakout BUY Level: 1.0660.
Strong Resistance:1.0653.
Original Resistance: 1.0643.
Inner Sell Area: 1.0633.
Target Inner Area: 1.0608.
Inner Buy Area: 1.0583.
Original Support: 1.0573.
Strong Support: 1.0563.
Breakout SELL Level: 1.0556.
More analysis - at instaforex.com
-
16-01-2017, 07:30 AM #2226Senior Investor
- Join Date
- Jun 2012
- Posts
- 3,492
- Feedback Score
- 0
- Thanks
- 0
- Thanked 9 Times in 9 Posts
Technical analysis of USD/JPY for January 16, 2017
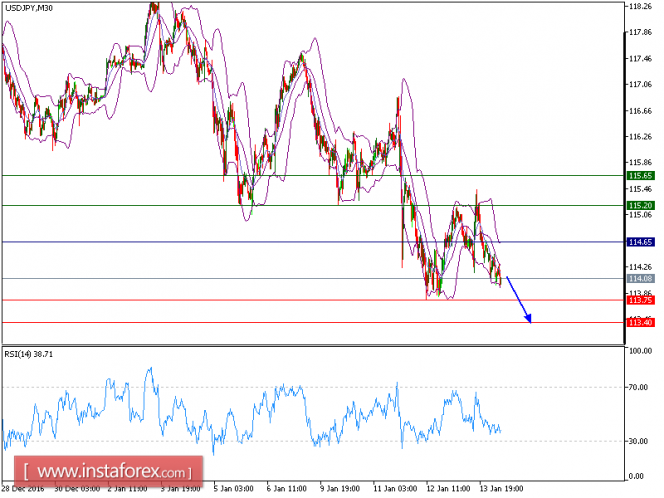
USD/JPY is Under pressure. The pair pulled back last Friday, and is now testing its nearest support at 114.00. The risk of a slide below this level remains high, as the relative strength index is badly directed, without showing any reversal signals.
The U.S. dollar showed some signs of rebounding energy upon the release of economic data. However, the upward momentum proved unsustainable. The ICE U.S. Dollar Index finally ended at 101.18 (day-high at 101.67), down 0.2% on day and extending its losing streak to a third session.
In which case, as long as 114.80 holds on the upside, further decline seems to be on the cards toward 113.75 (Jan 12 low).
Recommendation:
The pair is trading below its pivot point. It is likely to trade in a lower range as long as it remains below the pivot point. Short positions are recommended with the first target at 113.75. A break below this target will move the pair further downwards to 113.40. The pivot point stands at 114.65. If the price moves in the opposite direction and bounces back from the support level, it will move above its pivot point. It is likely to move further to the upside. According to that scenario, long positions are recommended with the first target at 115.20 and the second one at 115.65.
Resistance levels: 115.20, 156.65, 116.05
Support levels: 113.75, 113.40, 113.00
More analysis - at instaforex.com
-
17-01-2017, 07:52 AM #2227Senior Investor
- Join Date
- Jun 2012
- Posts
- 3,492
- Feedback Score
- 0
- Thanks
- 0
- Thanked 9 Times in 9 Posts
Elliott wave analysis of EUR/NZD for January 17, 2017
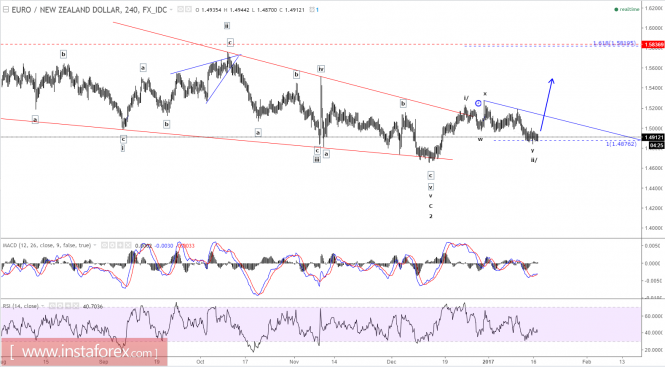
Wave summary:
We continue to look for evidence that the double zig-zag correction from 1.5235 is complete. The first solid evidence, will be a break above minor resistance at 1.5007, while a break above resistance at 1.5193 confirms that the wave iii/ higher toward 1.5837 and above longer term has taken over. That said, we have to acknowledge the risk of a third zig-zag unfolding. If this is the case, then more downside toward 1.4778 could be seen before the next impulsive rally finally takes over.
R3: 1.5193
R2: 1.5050
R1: 1.5007
Pivot: 1.4895
S1: 1.4841
S2: 1.4810
S3: 1.4778
Trading recommendation:
We will only buy a break above 1.500
More analysis - at instaforex.com
-
18-01-2017, 07:19 AM #2228Senior Investor
- Join Date
- Jun 2012
- Posts
- 3,492
- Feedback Score
- 0
- Thanks
- 0
- Thanked 9 Times in 9 Posts
Technical analysis of EUR/USD for Jan 18, 2017
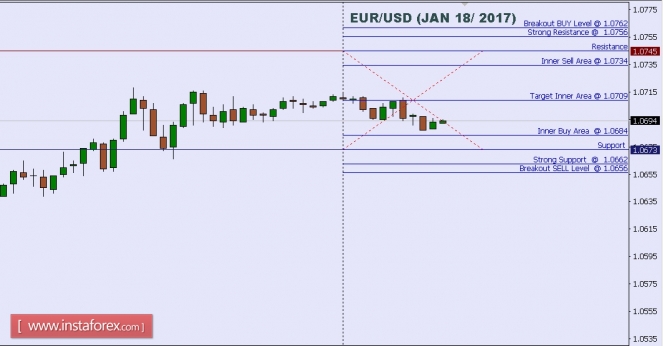
When the European market opens, some Economic Data will be released, such as Final Core CPI y/y, Final CPI y/y and German Final CPI m/m. The US will release the economic data, too, such as TIC Long-Term Purchases, Beige Book, NAHB Housing Market Index, Industrial Production m/m, Capacity Utilization Rate, Core CPI m/m, CPI m/m and the Fed Chair Yellen Speaks, so, amid the reports, EUR/USD will move in a low to medium volatility during this day.
TODAY'S TECHNICAL LEVEL:
Breakout BUY Level: 1.0762.
Strong Resistance:1.0756.
Original Resistance: 1.0745.
Inner Sell Area: 1.0734.
Target Inner Area: 1.0709.
Inner Buy Area: 1.0684.
Original Support: 1.0673.
Strong Support: 1.0662.
Breakout SELL Level: 1.0656.
More analysis - at instaforex.com
-
19-01-2017, 07:34 AM #2229Senior Investor
- Join Date
- Jun 2012
- Posts
- 3,492
- Feedback Score
- 0
- Thanks
- 0
- Thanked 9 Times in 9 Posts
Technical analysis of USD/JPY for Jan 19, 2017
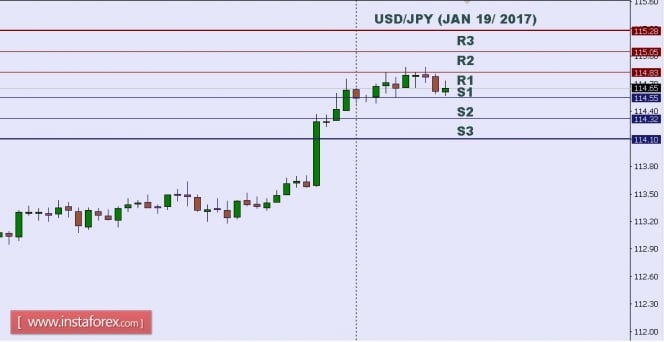
In Asia, today Japan will not release any Economic Data, but the US will release some Economic Data, such as Crude Oil Inventories, Natural Gas Storage, Housing Starts, Unemployment Claims, Philly Fed Manufacturing Index, Building Permits and the Fed Chair Yellen Speaks. So, there is a probability the USD/JPY will move with low to medium volatility during this day.
TODAY'S TECHNICAL LEVEL:
Resistance. 3: 115.28.
Resistance. 2: 115.05.
Resistance. 1: 114.83.
Support. 1: 114.55.
Support. 2: 114.32.
Support. 3: 114.10.
More analysis - at instaforex.com
-
20-01-2017, 10:28 AM #2230Senior Member

- Join Date
- Feb 2013
- Posts
- 212
- Feedback Score
- 0
- Thanks
- 0
- Thanked 0 Times in 0 Posts
Technical analysis of EUR/USD for Jan 20, 2017
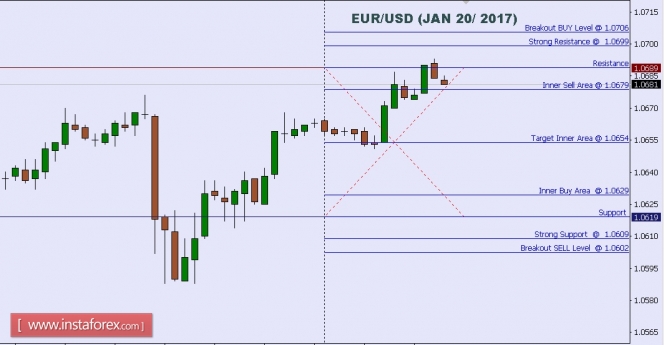
When the European market opens, some economic data will be released such as German PPI m/m. Today the US will not release any economic reports. So against this background, EUR/USD will move with low to medium volatility during this day.
TODAY'S TECHNICAL LEVELS:
Breakout BUY Level: 1.0706.
Strong Resistance:1.0699.
Original Resistance: 1.0689.
Inner Sell Area: 1.0679.
Target Inner Area: 1.0654.
Inner Buy Area: 1.0629.
Original Support: 1.0619.
Strong Support: 1.0609. Breakout SELL Level: 1.0602.
More analysis - at instaforex.com
-
Sponsored Links


 Reply With Quote
Thread Information
Users Browsing this Thread
There are currently 2 users browsing this thread. (0 members and 2 guests)
 Posting Permissions
24 Hour Gold

Advertising
- Over 20.000 UNIQUE Daily!
- Get Maximum Exposure For Your Site!
- Get QUALITY Converting Traffic!
- Advertise Here Today!
Out Of Billions Of Website's Online.
Members Are Online From.
- Get Maximum Exposure For Your Site!
- Get QUALITY Converting Traffic!
- Advertise Here Today!
Out Of Billions Of Website's Online.
Members Are Online From.


