
 LinkBack URL
 About LinkBacks
Technical analysis of USD/CHF for May 8, 2017
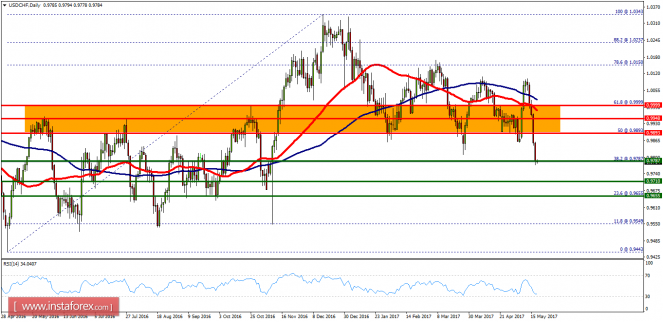
USD/CHF is under pressure as the key resistance is set at 0.9915. The pair stays below its resistance at 0.8490, and is capped by its 50-period moving average. Meanwhile, the 20-period moving average is still below the 50-period moving average, and the relative strength index is around its neutrality area at 50, lacking upward momentum.
The U.S. Labor Department reported that nonfarm payrolls increased by 211,000 in April, higher than +188,000 expected. The jobless rate edged down 0.1 percentage point to 4.4% (vs. 4.6% expected), its lowest level since May 2007.
As long as the key resistance at 0.9915 is not broken above, the risk of a break below 0.98660 remains high. A further down leg to 0.9840 and 0.9810 is also likely.
Resistance levels: 0.9930, 0.9950, and 0.9975
Support levels: 0.9860, 0.9840, and 0.9810
InstaForex analytical reviews will make you fully aware of market trends!
Being an InstaForex client, you are provided with a large number of free services for efficient trading.
More analysis - at instaforex.com
Please visit our sponsors
Results 2,301 to 2,310 of 4086
Thread: InstaForex Wave Analysis
-
08-05-2017, 09:17 AM #2301Senior Member


- Join Date
- Feb 2013
- Posts
- 212
- Feedback Score
- 0
- Thanks
- 0
- Thanked 0 Times in 0 Posts

-
09-05-2017, 08:19 AM #2302Senior Member
- Join Date
- Feb 2013
- Posts
- 212
- Feedback Score
- 0
- Thanks
- 0
- Thanked 0 Times in 0 Posts
Technical analysis of NZD/USD for May 09, 2017
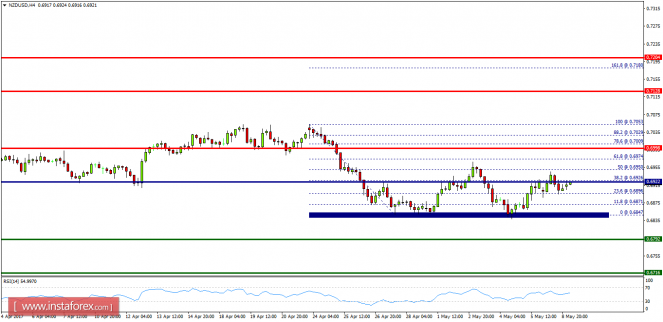
Overview:
The NZD/USD pair continues to move upwards from the level of 0.6847. Today, the first support level is currently seen at 0.6847, the price is moving in a bullish channel now. The level of 0.6847 coincides with the double bottom, which is expected to act as a minor support today. Besides, the double bottom is seen at the point of 0.6847. Since the trend is above the level of 0.6847, the market is still in an uptrend because the major support is seen at the level of 0.6847. Furthermore, the trend is still showing strength above the moving average (100). Thus, the market is indicating a bullish opportunity above the mentioned support levels, for that the bullish outlook remains the same as long as the 100 EMA is heading upwards. Therefore, strong support will be found at the level of 0.6847 providing a clear signal to buy with a target seen at 0.6998. If the trend breaks the first resistance at 0.6998, the pair will move upwards continuing the bullish trend development to the level 0.7053 in order to test the double top. Besides, it should be noted that the pivot is seen at 0.6922. However, the price spot of 0.6847 and 0.6871 remains a significant support zone. Thus, the trend is still bullish as long as the level of 0.6847 is not breached.
InstaForex analytical reviews will make you fully aware of market trends!
Being an InstaForex client, you are provided with a large number of free services for efficient trading.
More analysis - at instaforex.com
-
10-05-2017, 09:23 AM #2303Senior Member
- Join Date
- Feb 2013
- Posts
- 212
- Feedback Score
- 0
- Thanks
- 0
- Thanked 0 Times in 0 Posts
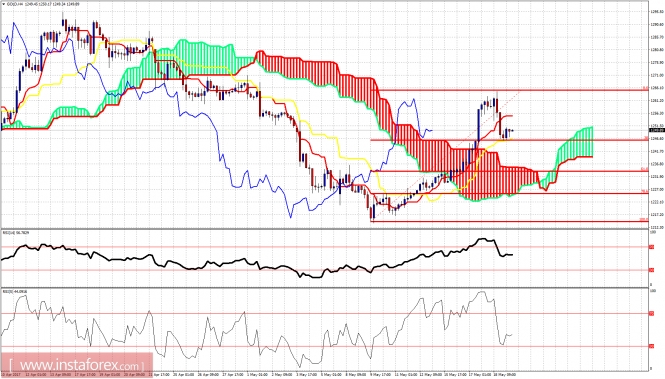
Ichimoku indicator analysis of Gold for May 10, 2017
Gold price continues to make lower lows and lower highs. Trend remains bearish. Gold has limited downside. I still prefer bullish positions at the current levels.
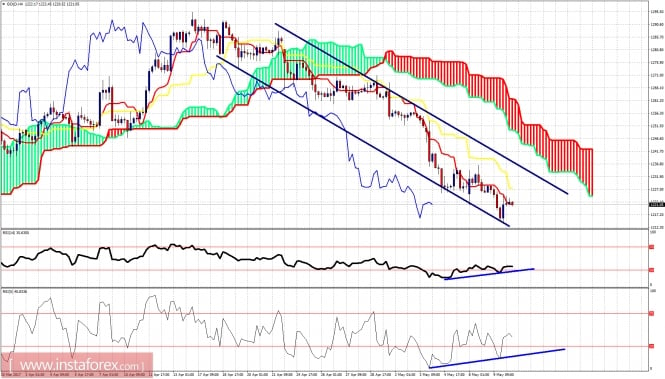
Blue lines - bearish channel
Despite being still inside the bearish channel and below both the tenkan- and kijun-sen, the RSI divergence signals that gold is just above previous lows at $1,194. I believe there are a lot of chances for a move higher at least towards the Kumo resistance at $1,250.
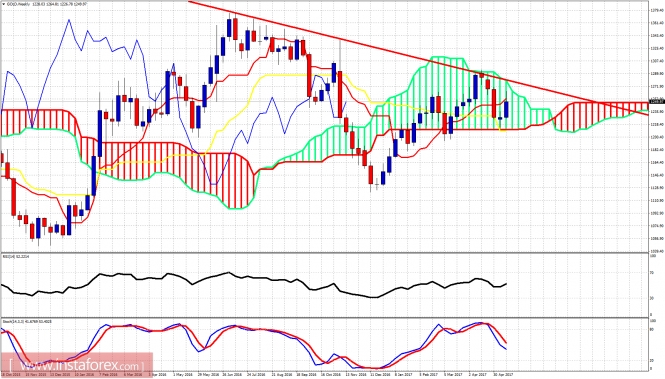
Red line -long-term resistance trend line
Gold price remains inside the weekly cloud but above the weekly kijun-sen. Price has held above the lower Kumo boundary and this is a positive sign. If Gold manages to make a higher low relative to the $1,194 low in March, we could expect a strong upward reversal start from around current levels.
InstaForex analytical reviews will make you fully aware of market trends!
Being an InstaForex client, you are provided with a large number of free services for efficient trading.
More analysis - at instaforex.com
-
11-05-2017, 08:52 AM #2304Senior Member
- Join Date
- Feb 2013
- Posts
- 212
- Feedback Score
- 0
- Thanks
- 0
- Thanked 0 Times in 0 Posts
Technical analysis of USD/JPY for May 11, 2017
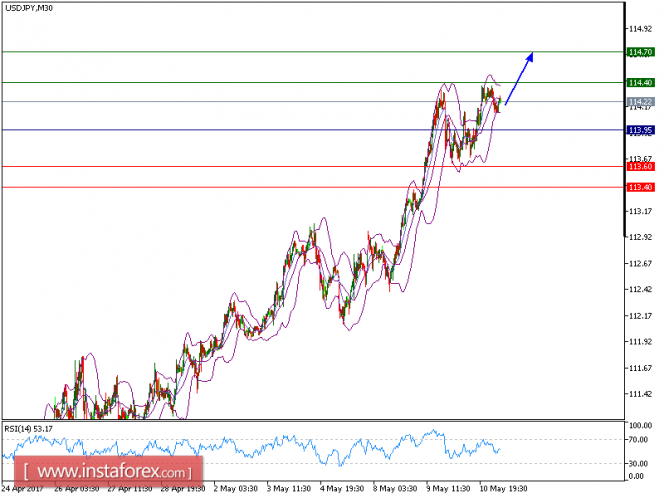
USD/JPY is expected to trade in a higher range. The pair validated an intraday triangle pattern, and resumed its uptrend. A bullish cross has been identified between the 20-period and 50-period moving averages, which should confirm a positive outlook. Besides, the relative strength index is bullish above its neutrality area at 50.
To conclude, as long as 113.95 holds on the downside, look for a continuation of the rebound to 114.40 and 114.70 in extension.
The pair is trading above its pivot point. It is likely to trade in a wider range as long as it remains above its pivot point. Therefore, long positions are recommended with the first target at 114.40 and the second one at 114.70. In the alternative scenario, short positions are recommended with the first target at 113.60 if the price moves below its pivot points. A break of this target may push the pair further downwards, and one may expect the second target at 113.40. The pivot point lies at 113.95.
Resistance levels: 114.35, 114.70, and 115.00
Support levels: 113.60, 113.10, and 112.65
InstaForex analytical reviews will make you fully aware of market trends!
Being an InstaForex client, you are provided with a large number of free services for efficient trading.
More analysis - at instaforex.com
-
12-05-2017, 09:26 AM #2305Senior Member
- Join Date
- Feb 2013
- Posts
- 212
- Feedback Score
- 0
- Thanks
- 0
- Thanked 0 Times in 0 Posts
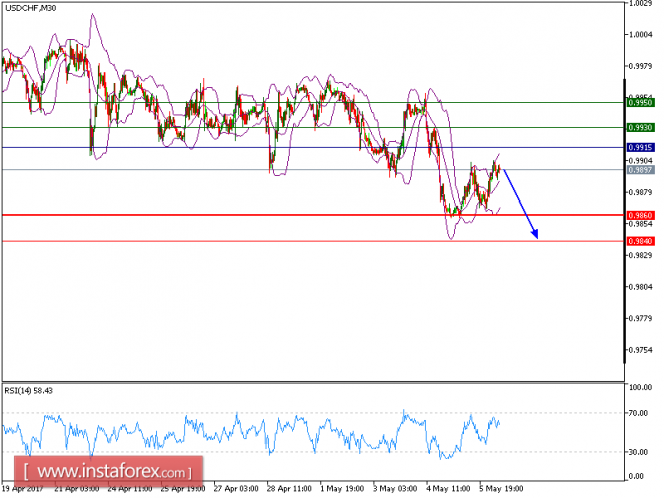
Technical analysis of USD/CHF for May 12, 2017
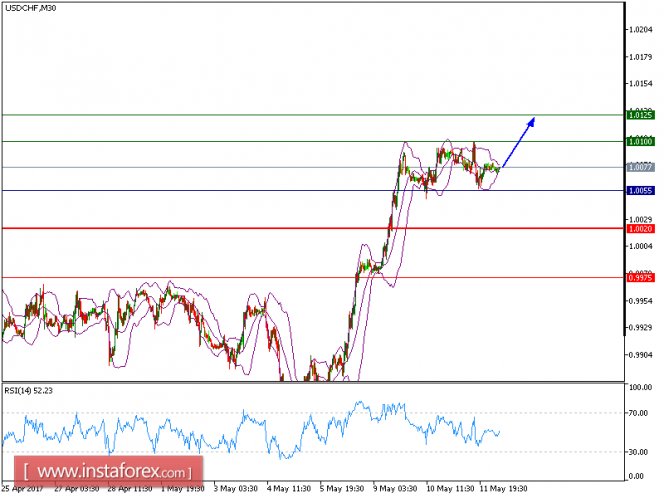
USD/CHF Intraday: Bullish bias above 1.0055. The pair has bounced up from another test of support at 1.0055, which is playing a key support role, and is challenging the 20-peiord moving average. The relative strength index is turning up below its neutrality level at 50.
Economic data remained robust. The Labor Department reported that initial jobless claims declined to 236,000 for the week ended May 6 (vs. 245,000 expected), and producer prices gained 0.5% on month in April (vs. +0.2% expected).
As long as the key support at 1.0055 holds on the downside, look for a further advance toward 1.0100 and even 1.0125 in extension.
Resistance levels: 1.0100, 1.0125, and 1.0160
Support levels: 1.0020, 0.9975, and 0.9930
InstaForex analytical reviews will make you fully aware of market trends!
Being an InstaForex client, you are provided with a large number of free services for efficient trading.
More analysis - at instaforex.com
-
15-05-2017, 09:35 AM #2306Senior Member
- Join Date
- Feb 2013
- Posts
- 212
- Feedback Score
- 0
- Thanks
- 0
- Thanked 0 Times in 0 Posts
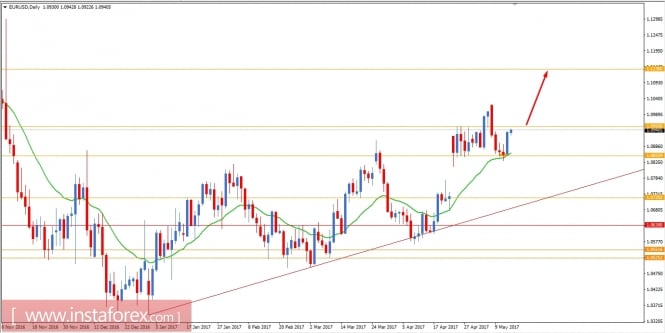
Fundamental Analysis of EUR/USD for May 15, 2017
EUR/USD aroused the interest of bulls on Friday after bouncing off from 1.0850 support level. EUR is currently stronger than USD in light of negative US CPI and Retail Sales reports published on Friday. Today, no economic reports are due in the eurozone, but on the USD side Empire State Manufacturing Index is expected to increase to 7.2 which previously was at 5.2. Besides, NAHB Housing Market Index is expected to be unchanged at 68. The economic reports from the US are not quite a high impact events but could bring some volatility in the market during the release. A daily close today will determine the upcoming move in the market where EUR is expected to gain ground against USD in the coming days.
Now let us look at the technical chart. The price is currently residing in the corrective area between 1.0850 and 1.0950. As of the bullish engulfing candle on Friday, the price is expected to move more up towards 1.1160 resistance level. For better confirmation, we will be looking forward for a daily close above 1.0950 for buying in this pair with a target towards 1.1160 level. On the other hand, if the price rejects off the 1.0950 with a daily candle, then we will consider sell positions with a first target towards 1.0850 and later at 1.0720 level. The bias in this pair is bullish until the price takes out 1.0850 with a daily close below it.
InstaForex analytical reviews will make you fully aware of market trends!
Being an InstaForex client, you are provided with a large number of free services for efficient trading.
More analysis - at instaforex.com
-
16-05-2017, 08:48 AM #2307Senior Member
- Join Date
- Feb 2013
- Posts
- 212
- Feedback Score
- 0
- Thanks
- 0
- Thanked 0 Times in 0 Posts
Technical analysis of GBP/JPY for May 16, 2017
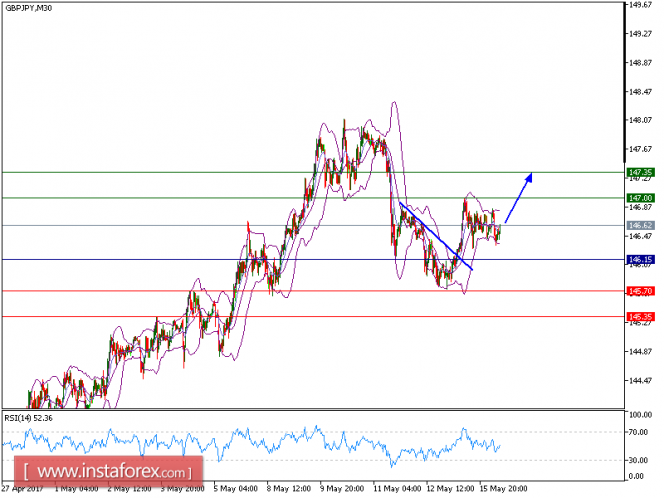
GBP/JPY is expected to extend its upside movement. The pair recorded a succession of higher tops and higher bottoms and is holding on the upside. The rising 50-period moving average is playing a support role and maintains the upside bias. The relative strength index is above its neutrality level at 50 and lacks downward momentum.
As long as 146.15 holds on the downside, look for a further advance towards 147.00 and even 147.35 in extension.
The pair is trading above its pivot point. It is likely to trade in a wider range as long as it remains above its pivot point. Therefore, long positions are recommended with the first target at 147.00 and the second one at 147.35. In the alternative scenario, short positions are recommended with the first target at 145.70 if the price moves below its pivot points. A break of this target may push the pair further downwards, and one may expect the second target at 145.35. The pivot point is at 146.15.
Resistance levels: 147.00, 147.35, and 148.60
Support levels: 145.70,145.35, and 144.65
InstaForex analytical reviews will make you fully aware of market trends!
Being an InstaForex client, you are provided with a large number of free services for efficient trading.
More analysis - at instaforex.com
-
17-05-2017, 11:56 PM #2308Senior Investor

- Join Date
- Aug 2012
- Posts
- 1,942
- Feedback Score
- 0
- Thanks
- 0
- Thanked 0 Times in 0 Posts
GBP/USD above strong support, prepare to buy on dips
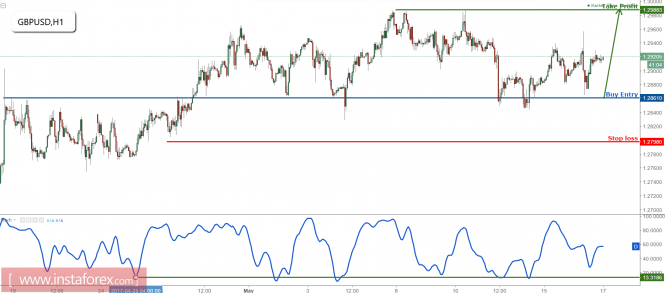
Price is above major support at 1.2861 (Fibonacci retracement, horizontal overlap support, Fibonacci extension) and we expect price to make a bounce above this level towards 1.2988 resistance
(Fibonacci extension, horizontal swing high resistance). Stochastic (34,5,3) is also seeing strong support above the 13% area where we expect further bullish action from.
Buy above 1.2861. Stop loss at 1.2798. Take profit at 1.2988.
Analysis are provided byInstaForex.
-
18-05-2017, 08:14 AM #2309Senior Member
- Join Date
- Feb 2013
- Posts
- 212
- Feedback Score
- 0
- Thanks
- 0
- Thanked 0 Times in 0 Posts
Technical analysis of USD/CHF for May 18, 2017
Overview: The USD/CHF pair continues to move downwards from the level of 0.9893.
Today, the first resistance level is seen at 0.9893 followed by 0.9948 as second resistance.
Also, the level of 0.9787 represents a weekly pivot point for that it will act as major resistance/support in coming hours.
Amid the previous events, the pair is still in a downtrend, because it is trading in a bearish trend from the new resistance line of 0.9893 towards the first support level at 0.9787 in order to test it.
If the pair succeeds to pass through the level of 0.9787, the market will indicate a bearish opportunity below the levels of 0.9710 and 0.9655.
However, if a breakout happens at the resistance level of 0.9893 (resistance 1), then this scenario may be invalidated.
Additionally, the support is found at 0.9893, which represents the 50% Fibonacci retracement level on the daily time frame. Since the trend is below the 50% Fibonacci level, the market is still in an downtrend.
InstaForex analytical reviews will make you fully aware of market trends!
Being an InstaForex client, you are provided with a large number of free services for efficient trading.
More analysis - at instaforex.com
-
19-05-2017, 09:38 AM #2310Senior Member
- Join Date
- Feb 2013
- Posts
- 212
- Feedback Score
- 0
- Thanks
- 0
- Thanked 0 Times in 0 Posts
Ichimoku indicator analysis of Gold for May 19, 2017
Gold price as expected is pulling back from the important weekly resistance at $1,260. Bulls now we need to see a higher low relative to the May lows at $1,214. A corrective pullback that will not hurt the bullish scenario should hold above $1,234.
Gold price is trading above the 4-hour cloud. Trend is bullish. Gold price could bounce from current levels as price has found support at the 38% Fibonacci retracement of the rise from $1,214. Next important support is at $1,234 where the 61.8% and the cloud supports are found. Bulls should not lose that level. On the other hand bears stopped the rise right at the important resistance of $1,260. Now they need to break back below the cloud for the move towards $1,150-60 to start.
Red line -long-term resistance
Gold remains inside the weekly Kumo (cloud). Weekly trend remains neutral. Price remains below the weekly trend line resistance. However the bounce off the lower cloud boundary was a bullish sign. Bulls however need to break above the weekly cloud at $1,280 for the bull trend to be confirmed.
InstaForex analytical reviews will make you fully aware of market trends!
Being an InstaForex client, you are provided with a large number of free services for efficient trading.
More analysis - at instaforex.com
-
Sponsored Links


 Reply With Quote
Thread Information
Users Browsing this Thread
There are currently 1 users browsing this thread. (0 members and 1 guests)
 Posting Permissions
24 Hour Gold

Advertising
- Over 20.000 UNIQUE Daily!
- Get Maximum Exposure For Your Site!
- Get QUALITY Converting Traffic!
- Advertise Here Today!
Out Of Billions Of Website's Online.
Members Are Online From.
- Get Maximum Exposure For Your Site!
- Get QUALITY Converting Traffic!
- Advertise Here Today!
Out Of Billions Of Website's Online.
Members Are Online From.


