
 LinkBack URL
 About LinkBacks
The XAU/USD pair is showing bearish potential, with a significant support at 1985.14, known as an overlap support. If the price drops further, the 2nd support at 1968.63, a swing low support, may offer a defensive stance.
On the upside, the 1st resistance at 1996.02 serves as an overlap resistance, and overcoming it could be challenging. Above that, the 2nd resistance at 2006.90, which is a multi-swing high resistance, could cap the upside.
Analysis are provided by InstaForex.
Read More
Please visit our sponsors
Results 4,001 to 4,010 of 4086
Thread: InstaForex Wave Analysis
-
24-11-2023, 05:46 AM #4001Senior Investor


- Join Date
- Jun 2012
- Posts
- 3,492
- Feedback Score
- 0
- Thanks
- 0
- Thanked 9 Times in 9 Posts

-
27-11-2023, 06:14 AM #4002Senior Investor
- Join Date
- Jun 2012
- Posts
- 3,492
- Feedback Score
- 0
- Thanks
- 0
- Thanked 9 Times in 9 Posts
Key events on November 27: fundamental analysis for beginners
Analysis of macroeconomic reports:
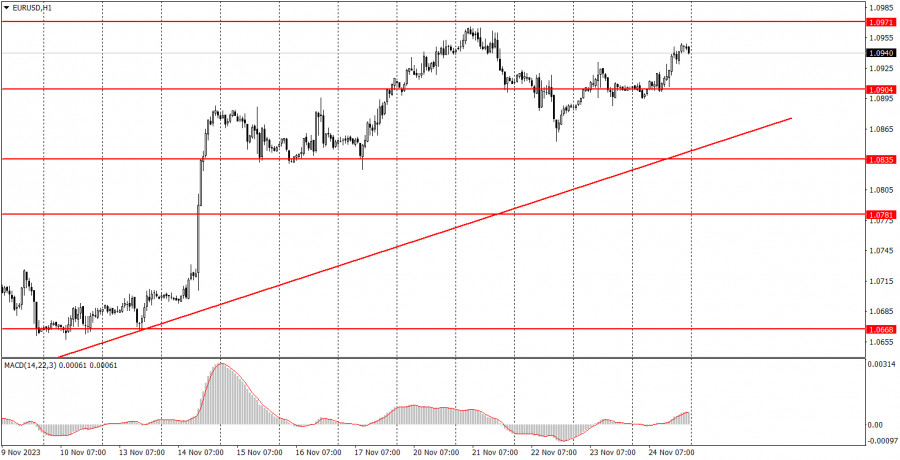
For Monday, there are hardly any macroeconomic events. We can only highlight the report on new home sales in the United States. Perhaps it will trigger a market reaction of around 20 pips, no more. There will be nothing else interesting in the US, the EU, the UK, or Germany. Therefore, it will likely turn out as another "boring Monday."
Analysis of fundamental events:
Among the fundamental events on Monday, we can highlight European Central Bank President Christine Lagarde's speech. However, Lagarde has already spoken several times and will repeatedly speak again. There has been nothing interesting in her speeches lately. This is not surprising since no one expects any drastic changes from the ECB at the moment. Most members of the Governing Council have expressed support for keeping the key rate unchanged for an extended period. So, what can Lagarde or her colleagues tell us now?
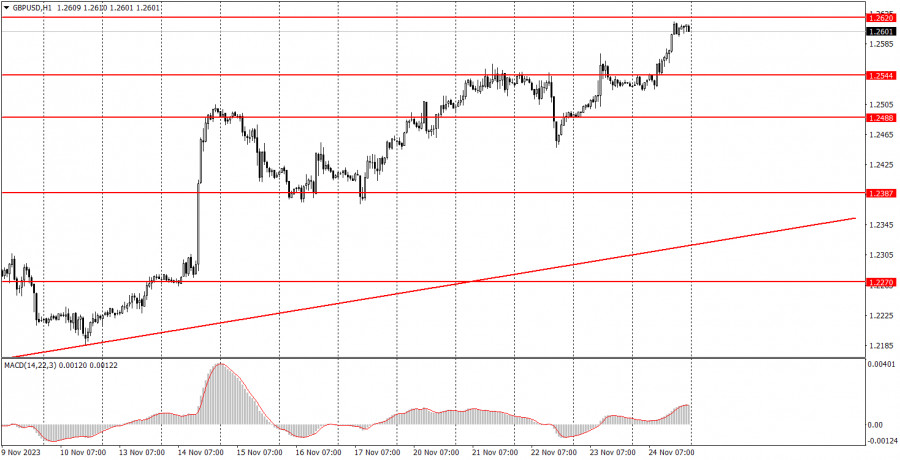
General conclusion: There are no interesting events on Monday. Perhaps Lagarde will finally announce something important, but hopes for this are frankly low. Therefore, most likely, we can expect a boring day. It is worth noting that both pairs can start a downward movement at any moment since they are both overbought.
Basic rules of a trading system:
1) Signal strength is determined by the time taken for its formation (either a bounce or level breach). A shorter formation time indicates a stronger signal.
2) If two or more trades around a certain level are initiated based on false signals, subsequent signals from that level should be disregarded.
3) In a flat market, any currency pair can produce multiple false signals or none at all. In any case, the flat trend is not the best condition for trading.
4) Trading activities are confined between the onset of the European session and mid-way through the U.S. session, post which all open trades should be manually closed.
5) On the 30-minute timeframe, trades based on MACD signals are only advisable amidst substantial volatility and an established trend, confirmed either by a trend line or trend channel.
6) If two levels lie closely together (ranging from 5 to 15 pips apart), they should be considered as a support or resistance zone.
How to read charts:
Support and Resistance price levels can serve as targets when buying or selling. You can place Take Profit levels near them.
Red lines represent channels or trend lines, depicting the current market trend and indicating the preferable trading direction.
The MACD(14,22,3) indicator, encompassing both the histogram and signal line, acts as an auxiliary tool and can also be used as a signal source.
Significant speeches and reports (always noted in the news calendar) can profoundly influence the price dynamics. Hence, trading during their release calls for heightened caution. It may be reasonable to exit the market to prevent abrupt price reversals against the prevailing trend.
Beginning traders should always remember that not every trade will yield profit. Establishing a clear strategy coupled with sound money management is the cornerstone of sustained trading success.
Analysis are provided by InstaForex.
Read More
-
28-11-2023, 07:57 AM #4003Senior Investor
- Join Date
- Jun 2012
- Posts
- 3,492
- Feedback Score
- 0
- Thanks
- 0
- Thanked 9 Times in 9 Posts
Forecast for EUR/USD on November 28, 2023
EUR/USD
After yesterday's bounce from the support of the green channel line, the price rose above the resistance at 1.0946, closing the day with a white candle. However, the signal line of the Marlin oscillator did not return to its own ascending channel and even strengthened the downward movement.
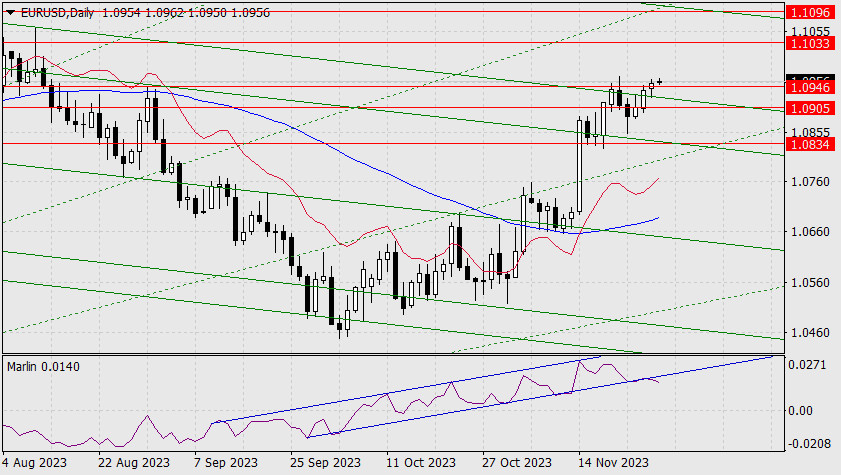
There is a risk to continuing the upward movement; the price can turn into a correction at any time. Nevertheless, the main bullish scenario is still valid; Marlin simply annuls the current channel and enters the formation of some other formation. However, in order to confirm the growth, Marlin must still turn upwards. The target level of 1.1033 remains relevant.
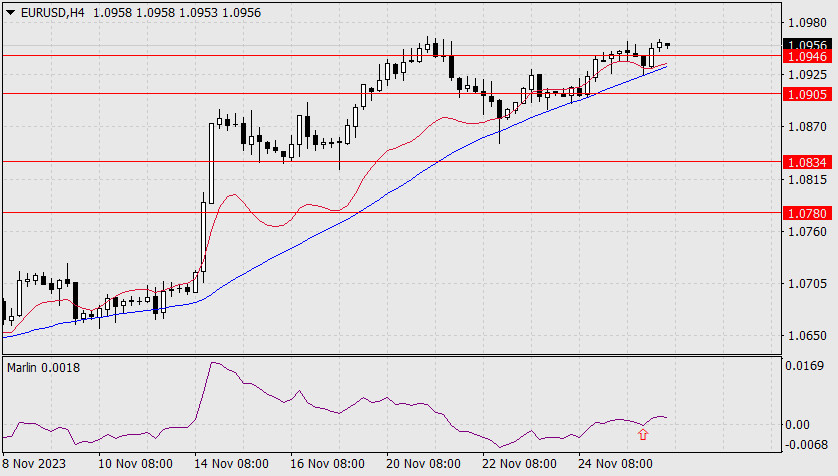
On the 4-hour chart, yesterday, the price tried to attack the support of the MACD indicator line, but failed. The signal line of the Marlin oscillator turned upward from the zero line. The uptrend may strengthen. We are waiting for the price at the nearest target level. To develop a correction, the price must overcome yesterday's low at 1.0926. The first corrective target will be 1.0905.
Analysis are provided by InstaForex.
Read More
-
29-11-2023, 04:56 AM #4004Senior Investor
- Join Date
- Jun 2012
- Posts
- 3,492
- Feedback Score
- 0
- Thanks
- 0
- Thanked 9 Times in 9 Posts
Forecast for USD/JPY on November 29, 2023
USD/JPY
The USD/JPY pair has been falling for the fourth day, at an accelerated pace for three days. The pair breached the support at 147.17 (November 21st low) this morning, and it can reach the target of 145.08 (June peak). The Marlin oscillator is also falling at a decent pace, but it is still far from the oversold territory. Even if the pair's downward movement slows down, we expect it to reach the target support.
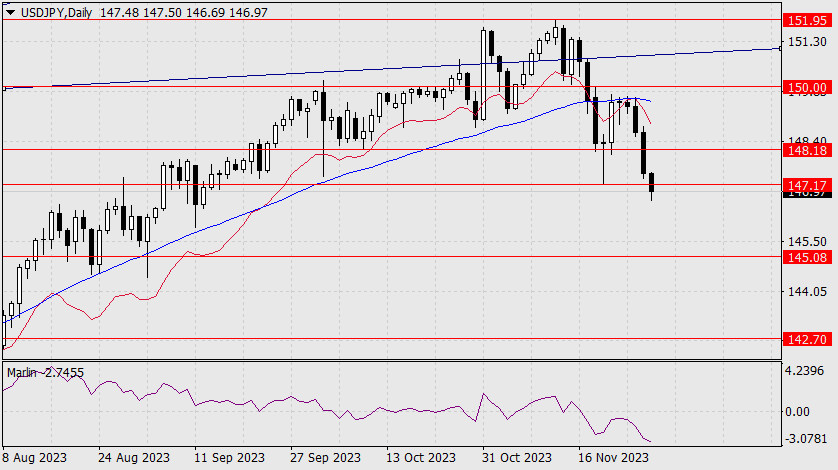
U.S. government bonds are rapidly losing yield. The yield on 5-year bonds has fallen from 4.51% to 4.25% since the beginning of the week. Along with this, the dollar is declining against the yen. Simultaneously, there are increasing rumors of the Bank of Japan abandoning its ultra-loose monetary policy soon.
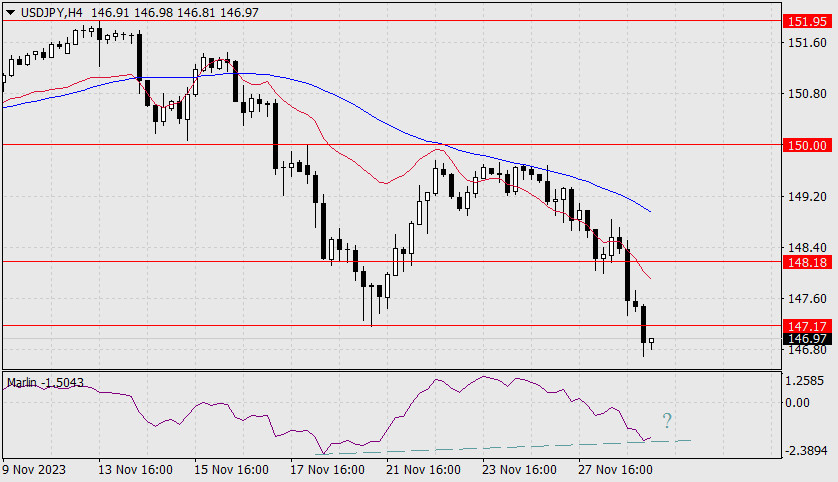
On the 4-hour chart, there are signs of a brewing convergence between the price and the Marlin oscillator. The main event of the day will be released in the evening – the U.S. GDP for the 3rd quarter. Depending on the risk sentiment, the USD/JPY pair will choose a corresponding strategy. Until then, the price may stall under the resistance at 147.17.
News are provided by
InstaForex.
Read More
-
30-11-2023, 07:36 AM #4005Senior Investor
- Join Date
- Jun 2012
- Posts
- 3,492
- Feedback Score
- 0
- Thanks
- 0
- Thanked 9 Times in 9 Posts
XAU/USD Day I Potential bearish reversal?
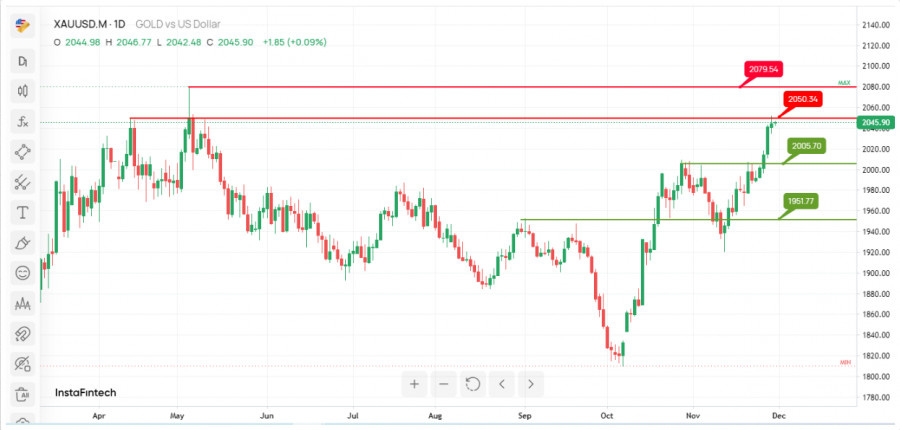
The XAU/USD is currently positioned for a potential bearish reversal, The chart is currently encountering major resistance levels, suggesting a potential bearish reversal.
The 1st resistance at 2050.34 is identified as a multi-swing high resistance. This implies that it's a significant barrier where selling interest could intensify, potentially triggering a reversal in the XAU/USD (Gold) market.
The 2nd resistance at 2079.54 is also noted as a swing high resistance, further reinforcing the potential resistance factors for the precious metal.
On the support side,
The 1st support at 2005.70 is categorized as a pullback support. This suggests that it's a significant level where buying interest may emerge, potentially providing some support for XAU/USD.
The 2nd support at 1951.77 is another support level identified as an overlap support. This adds further significance to this support level, indicating it as a potential area where buyers might become active, potentially mitigating the bearish reversal.
Analysis are provided by InstaForex.
Read More
-
01-12-2023, 05:40 AM #4006Senior Investor
- Join Date
- Jun 2012
- Posts
- 3,492
- Feedback Score
- 0
- Thanks
- 0
- Thanked 9 Times in 9 Posts
Catherine Mann: The Bank of England may still need to raise rates
Inflation in the United Kingdom remains consistently high, although it has decreased to 4.6% in the last six months. Recall that Bank of England Governor Andrew Bailey and some of his colleagues promised to reduce inflation to 5% or below by the end of this year. At the moment, we can say that they have managed to keep their promise, but inflation in Britain remains persistently high, with wages growing at 8% annually, and core inflation currently standing at 5.7%.
Judging by data on price and wage inflation, we can see that the BoE is currently closest to a new interest rate hike. Recently, we have repeatedly heard that the British central bank prefers to keep the rate at its current level for a period long enough to return inflation to 2%. However, such measures may not be sufficient.
BoE Monetary Policy Committee member Catherine Mann said that the prospects of maintaining the current inflation could compel the central bank to tighten monetary policy more than it is doing now. Mann stated that the current BoE policy can be considered "sufficiently restrictive" only for a very short period and exerts relatively weak pressure on price growth. According to her, many companies expect inflationary pressures to persist next year. Accordingly, the BoE may tighten its policy once again.
This is the factor that can desynchronize the pound and the euro. The European Central Bank has no grounds to raise rates after the latest inflation report. Moreover, it may move to rate cuts in the near future. If we believe Mann's words, the BoE may need another rate hike, and the probability of such a scenario is quite high. This is a supporting factor for the pound but not for the euro.
In conclusion, I expect both instruments to fall. The BoE has not given any signals of readiness to move from words to action. In the last meeting, only three members of the Committee voted for a rate hike. Therefore, the euro and the pound can safely decline for now.
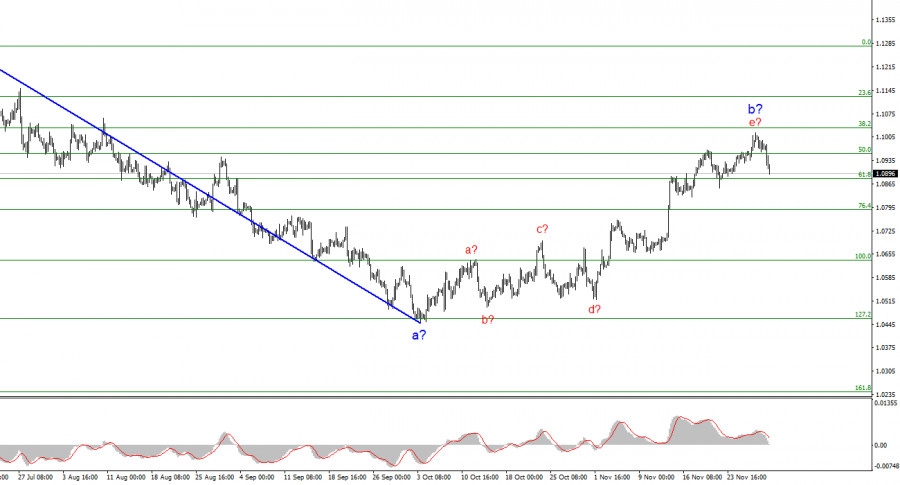
Based on the analysis, I conclude that a bearish wave pattern is still being formed. The pair has reached the targets around the 1.0463 mark, and the fact that the pair has yet to breach this level indicates that the market is ready to build a corrective wave. It seems that the market has completed the formation of wave 2 or b, so in the near future I expect an impulsive descending wave 3 or c with a significant decline in the instrument. I still recommend selling with targets below the low of wave 1 or a. But be cautious with short positions, as wave 2 or b may take a more extended form. A successful attempt to break the 1.0851 level could signal a decline in the instrument.
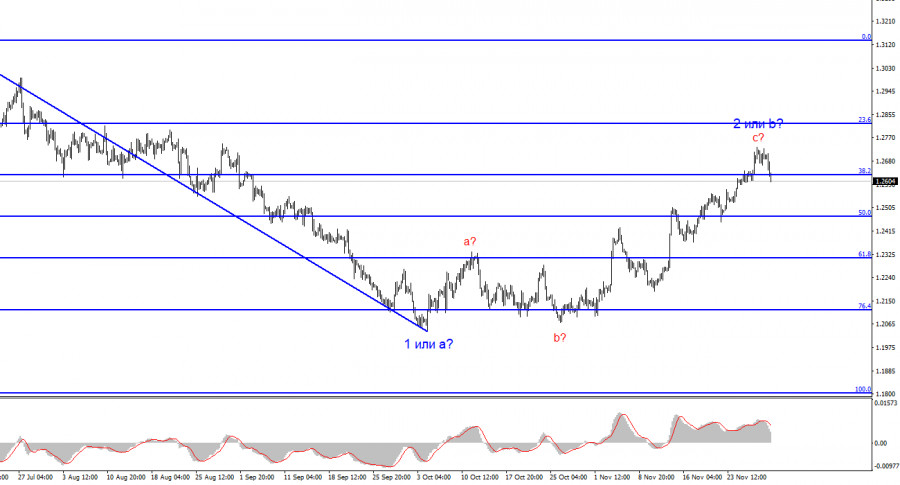
The wave pattern for the GBP/USD pair suggests a decline within the downtrend. The most that we can count on is a correction. At this time, I can recommend selling the instrument with targets below the 1.2068 mark because wave 2 or b will eventually end and at any time. The longer it takes, the stronger the fall. The narrowing triangle is a harbinger to the end of the movement.
Analysis are provided by InstaForex.
Read More
-
04-12-2023, 09:36 AM #4007Senior Investor
- Join Date
- Jun 2012
- Posts
- 3,492
- Feedback Score
- 0
- Thanks
- 0
- Thanked 9 Times in 9 Posts
AUD/USD Update for December 04, 2023 - Berish divergence on the oscillator
Technical analysis:
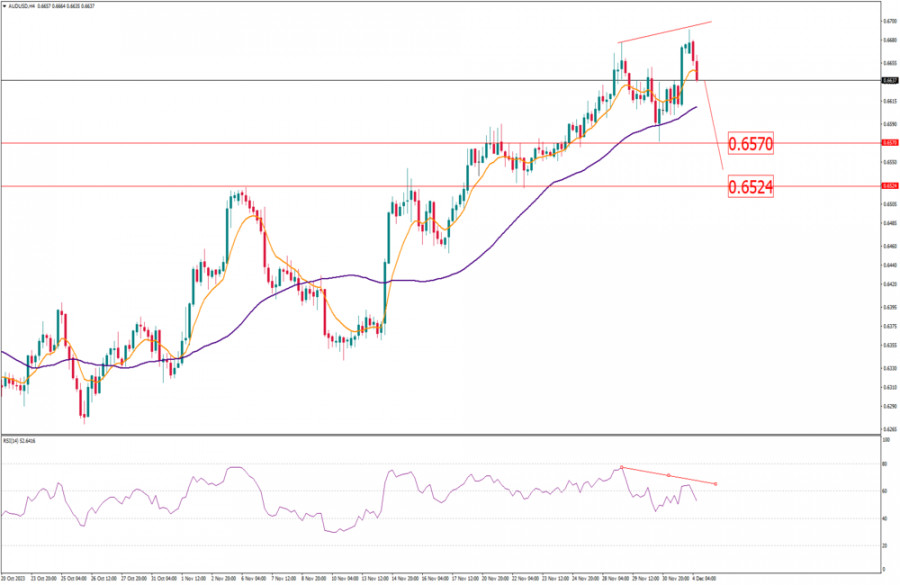
AUD/USD has been trading downside this morning and I found rejection of the previous swing high at 0.6680, which is good sign for the further downside movement.
Due to the rejection of the previous swing high and the bearish divergence on the RSI oscillator, I see potential for the further drop towards lower references.
Downside objectives are set at the price of 0.6570 and 0.6524
RSI oscillator is showing fresh bearish divergence in the background, which is sign for the downside rotation.
Key resistance is set at the price of 0.6680
Analysis are provided by InstaForex.
Read More
-
05-12-2023, 06:31 AM #4008Senior Investor
- Join Date
- Jun 2012
- Posts
- 3,492
- Feedback Score
- 0
- Thanks
- 0
- Thanked 9 Times in 9 Posts
USD/CAD I Bearish Reversal?
The USD/CAD chart is showing signs of a potential bearish reversal, with significant support and resistance levels in play.
Resistance Levels:
At 1.35788, the 1st resistance level is characterized as "Pullback resistance." This level signifies a zone where selling pressure may emerge, potentially hindering upward momentum. Additionally, the 2nd resistance level at 1.35280 is identified as "An Overlap resistance," reinforcing its role as a significant resistance zone.
Support Levels:
On the support side, the 1st support level at 1.34893 is labeled as "Swing low support." This level implies a potential area where buying interest may emerge, serving as a crucial support zone. Similarly, the 2nd support level at 1.34304 is characterized as "Swing low support," reinforcing its potential to provide support to the price.
Analysis are provided by InstaForex.
Read More
-
06-12-2023, 07:40 AM #4009Senior Investor
- Join Date
- Jun 2012
- Posts
- 3,492
- Feedback Score
- 0
- Thanks
- 0
- Thanked 9 Times in 9 Posts
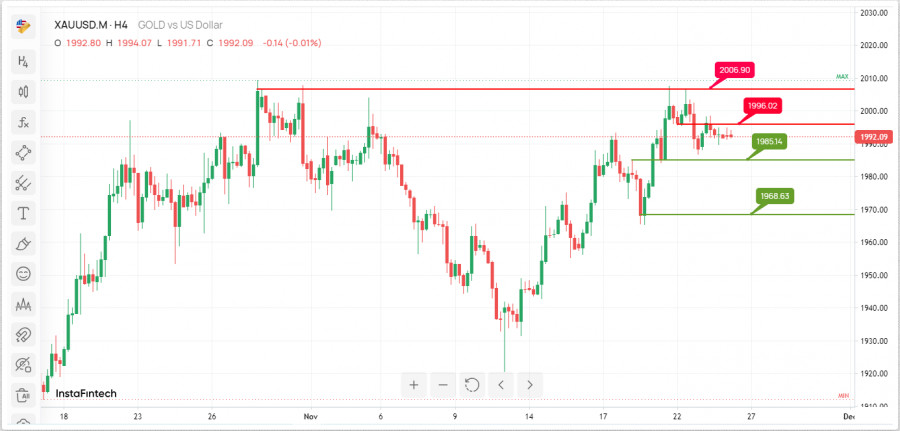
XAU/USD H4 I Bullish Bounce?
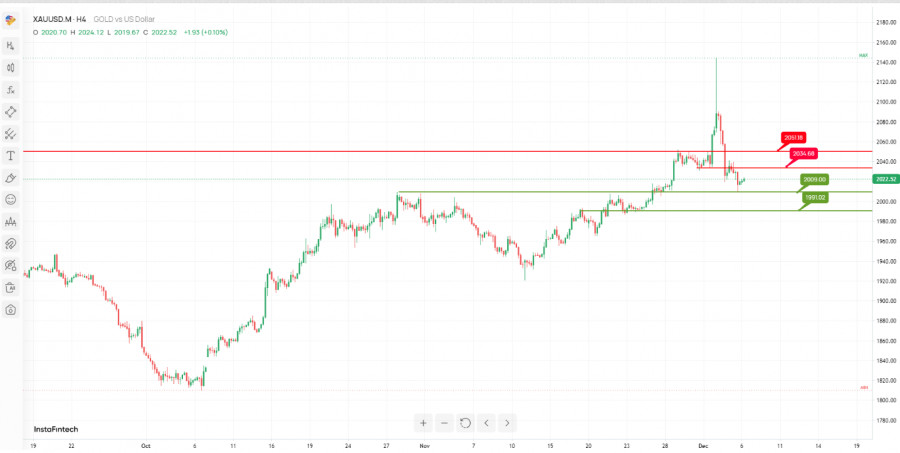
The XAU/USD chart suggests the potential for a bullish bounce, with significant support and resistance levels at play.
Support Levels:
At 2009.00, the 1st support is characterized as "An Overlap support." This level signifies a potential area where buying interest may emerge, potentially facilitating a bounce. Similarly, the 2nd support at 1991.00 is also identified as "An Overlap support," reinforcing its potential significance in providing support to the price.
Resistance Levels:
On the resistance side, the 1st resistance level at 2034.68 is labeled as "An Overlap resistance." This level represents a notable barrier to further upward price movement and warrants attention from traders. Additionally, the 2nd resistance at 2051.18 is characterized by "Pullback resistance," further emphasizing its role as a significant resistance zone.
Analysis are provided by InstaForex.
Read More
-
07-12-2023, 05:14 AM #4010Senior Investor
- Join Date
- Jun 2012
- Posts
- 3,492
- Feedback Score
- 0
- Thanks
- 0
- Thanked 9 Times in 9 Posts
USD/JPY Day I Bearish continuation expected?
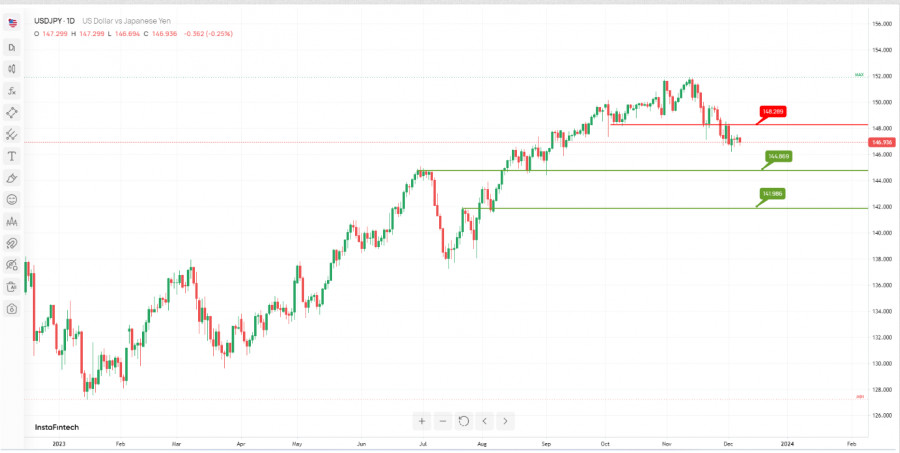
The USD/JPY chart is currently indicating the potential for a bearish breakout, with significant support and resistance levels at play.
Support Levels:
At 144869.00, the 1st support is characterized as "An Overlap support." This level signifies a potential area where buying interest may emerge, potentially preventing further downward movement. Additionally, the 2nd support at 141.98 is identified as "An Overlap support," further reinforcing its potential significance in providing support to the price.
Resistance Levels:
On the resistance side, the 1st resistance level at 148.28 is labeled as "An Overlap resistance." This level represents a notable barrier to further upward price movement and warrants attention from traders.
Analysis are provided by InstaForex.
Read More
-
Sponsored Links


 Reply With Quote
Thread Information
Users Browsing this Thread
There are currently 2 users browsing this thread. (0 members and 2 guests)
 Posting Permissions
24 Hour Gold

Advertising
- Over 20.000 UNIQUE Daily!
- Get Maximum Exposure For Your Site!
- Get QUALITY Converting Traffic!
- Advertise Here Today!
Out Of Billions Of Website's Online.
Members Are Online From.
- Get Maximum Exposure For Your Site!
- Get QUALITY Converting Traffic!
- Advertise Here Today!
Out Of Billions Of Website's Online.
Members Are Online From.


