
 LinkBack URL
 About LinkBacks
Forex Analysis & Reviews: Forecast for USD/JPY on December 23, 2022
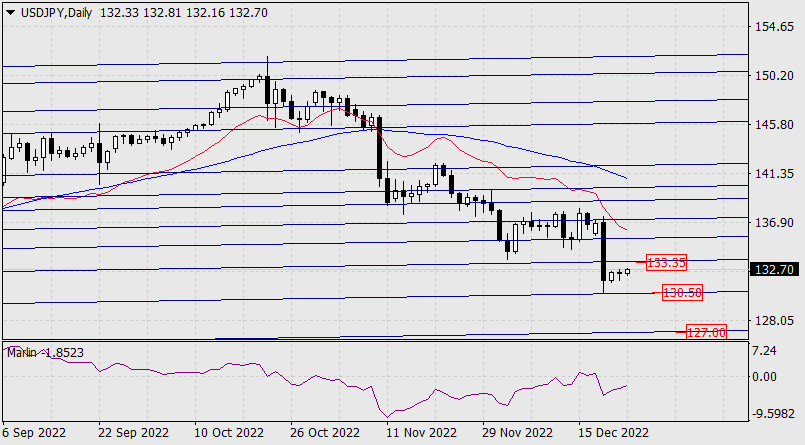
Yesterday, the yen was calm, its slow growth (growth of the USD/JPY pair which means that the dollar rose) did not face any resistance, so this morning it continues to gradually rise. The price is facing the 133.35 target, the nearest internal resistance line in the price hyperchannel of the monthly chart.
The Marlin oscillator can grow without interruptions until it touches the zero line. From 133.35, a synchronous reversal of the price and the oscillator downwards, to the target of 130.58.
Yesterday, the U.S. stock index S&P 500 fell by 1.45%, and if the yen, with the Bank of Japan's help, will push for its role as a safe haven, then the pair could fall further to support around 127.00.
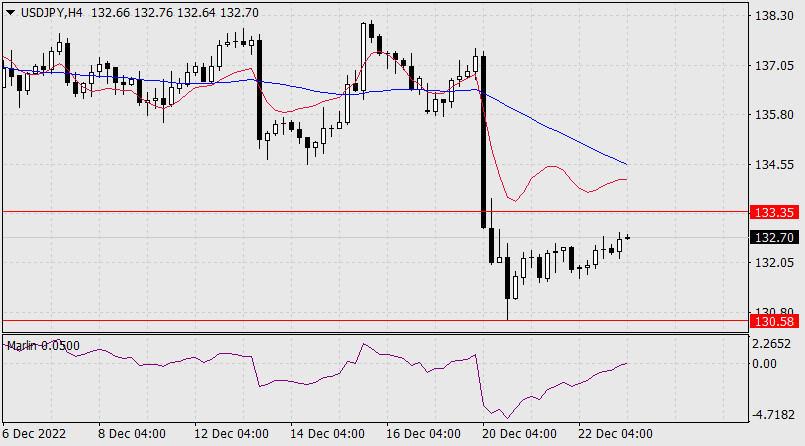
On the four-hour chart, the Marlin oscillator has already reached the zero line. But the price can still reach 133.35. The main movement is likely to occur after the Christmas holidays.
*The market analysis posted here is meant to increase your awareness, but not to give instructions to make a trade.
Analysis are provided by InstaForex.
Read More
Please visit our sponsors
Results 3,731 to 3,740 of 4086
Thread: InstaForex Wave Analysis
-
23-12-2022, 06:27 AM #3731Senior Investor


- Join Date
- Jun 2012
- Posts
- 3,492
- Feedback Score
- 0
- Thanks
- 0
- Thanked 9 Times in 9 Posts

-
26-12-2022, 06:32 AM #3732Senior Investor
- Join Date
- Jun 2012
- Posts
- 3,492
- Feedback Score
- 0
- Thanks
- 0
- Thanked 9 Times in 9 Posts
Forex Analysis & Reviews: GBP/USD. Overview for December 26, 2022
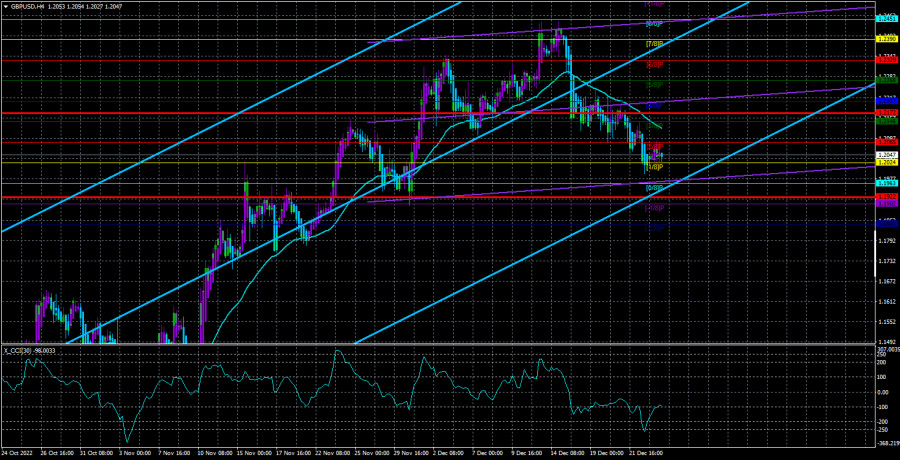
In contrast to the EUR/USD pair, the GBP/USD currency pair is still in motion. Now that the pound is at least moving and not just standing still, we aren't talking about a volatile movement anymore. Although, based on Friday, there were no noteworthy movements, the pound/dollar pair may also experience a flat in the upcoming months. In essence, there were the same reports from the United States on Friday regarding the pound and the euro. And as we can see, they had no impact on the pair's movement. Given that the reports were so brief, this does not surprise us. The month's major events are all over, and now that the holidays have started, there is no doubt that traders are less motivated to engage in active trading.
Technically speaking, the price is still below the moving average, and the downward movement is still present. Thus, everything in this situation makes sense. For the past three weeks, we have been anticipating a significant downward correction. It is not yet "strong," but at least it has something. Since the British economy may experience a severe recession and the Bank of England rate will not continue to rise at its current rate indefinitely, we think the pound should continue to decline against the US dollar. However, inflation is still out of control, and we have serious doubts that it will start to slow down soon at a rate comparable to that in the United States. This compels the Bank of England to keep tightening monetary policy, on the one hand. On the other hand, the third quarter saw a decline in the economy, and officials have predicted a two-year recession. Tightening monetary policy inevitably means making the recession worse. As a result, we don't think the British regulator will keep raising the rate by 0.50% every time they meet.
The period of consolidation might start soon.
The absence of trend movement in the overall plan is what we refer to as the consolidation period. Recall that the pair's growth over the past few months, which is a correction in and of itself, followed an approximately two-year downward trend. As a result, the correction against the correction has already started. After that, the pair may enter a long-term "swing" on the senior TF, which would indicate the absence of any new significant factors like a global tightening or loosening of monetary policy or changes in geopolitics. We won't be surprised if 2023 also has surprises because of the trend of recent years (the situation is getting worse and worse every year). The "coronavirus" is raging in China, and it is dispersing at a completely abnormal rate, according to the most recent information. One of the messages mentioned a day-long infection of 37 million people. As a result, COVID still terrorizes humanity and has not disappeared. The world will once more experience economic issues if it spills out of the Celestial Empire. Lockdowns, quarantines, and widespread infections can all begin anew. Then there are the central bank incentive plans and a new rise in inflation. Overall, it is still very early to resolve this problem.
We are also certain that there will be geopolitical news. Many military experts believe that the coming year will be crucial in the military conflict in Ukraine. We cannot define what "decisive" means, but we can only state that neither side in this conflict intends to engage in peace talks. Therefore, in our opinion, it will only get worse and continue. Additionally, the euro and the pound are risky currencies that will happily decline if the global situation deteriorates. It still hasn't even calmed down.
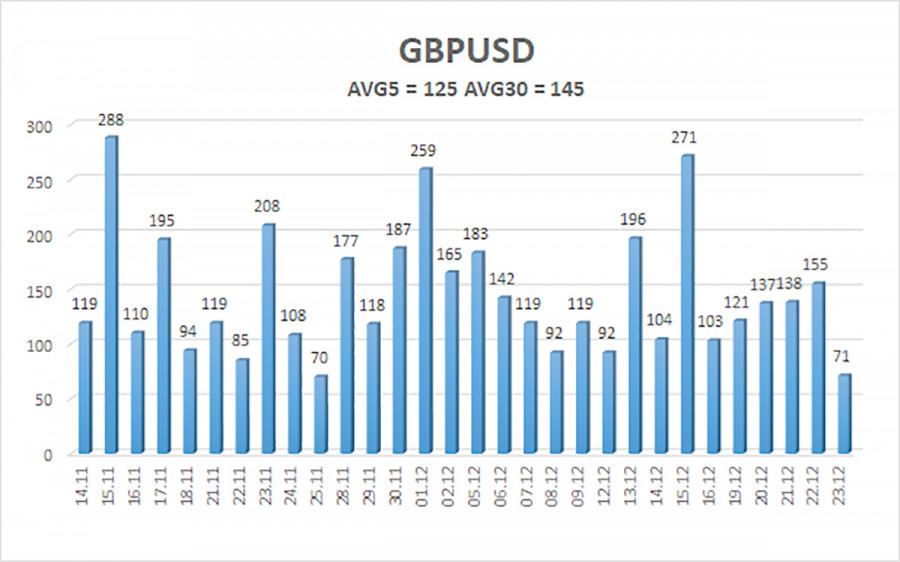
Over the previous five trading days, the GBP/USD pair has averaged 131 points of volatility. This value is "high" for the dollar/pound exchange rate. As a result, on Friday, December 23, we anticipate channel movement that is constrained by levels of 1.1899 and 1.2161. A round of upward correction will begin if the Heiken Ashi indicator reverses direction upward.
Nearest levels of support
S1 – 1.2024
S2 – 1.1963
S3 – 1.1902
Nearest levels of resistance
R1 – 1.2085
R2 – 1.2146
R3 – 1.2207
Trading Suggestions:
On the 4-hour timeframe, the GBP/USD pair is still trending downward. Therefore, until the Heiken Ashi indicator appears, you should maintain sell orders with targets of 1.1963 and 1.1899. When the moving average is fixed above, buy orders should be placed with targets of 1.2207 and 1.2268.
Illustration explanations:
Linear regression channels are used to identify the current trend. The trend is currently strong if they are both moving in the same direction.
Moving average line (settings 20.0, smoothed): This indicator identifies the current short-term trend and the trading direction.
Murray levels serve as the starting point for adjustments and movements.
Based on current volatility indicators, volatility levels (red lines) represent the likely price channel in which the pair will trade the following day.
A trend reversal in the opposite direction is imminent when the CCI indicator
*The market analysis posted here is meant to increase your awareness, but not to give instructions to make a trade.
Analysis are provided by InstaForex.
Read More
-
27-12-2022, 09:29 AM #3733Senior Investor
- Join Date
- Jun 2012
- Posts
- 3,492
- Feedback Score
- 0
- Thanks
- 0
- Thanked 9 Times in 9 Posts
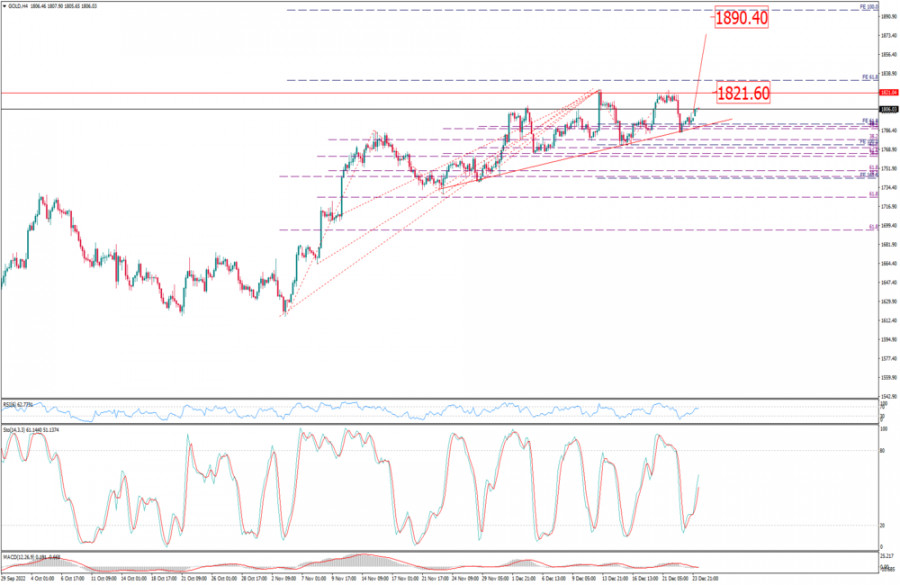
Forex Analysis & Reviews: Analysis of Gold for December 27,.2022 - Potential for the further growth
Technical analysis:
Gold has been trading upside as I expected and there is potential for the further growth.
Trading recommendation:
Due to the rejection of the rising trend-line and strong upside trend in the background, I see potential for the further growth.
Watch for the potential buying opportunities on the intraday dips with the first upside objective at the price of $1.821
Stochastic oscillator is showing fresh upside momentum, which is strong sign that buyers are in control.
Key support is set at the price of $1.783
*The market analysis posted here is meant to increase your awareness, but not to give instructions to make a trade.
Analysis are provided by InstaForex.
Read More
-
28-12-2022, 10:00 AM #3734Senior Investor
- Join Date
- Jun 2012
- Posts
- 3,492
- Feedback Score
- 0
- Thanks
- 0
- Thanked 9 Times in 9 Posts
Forex Analysis & Reviews: Technical Analysis of Intraday Price Movements of USD Index, Wednesday December 28, 2022
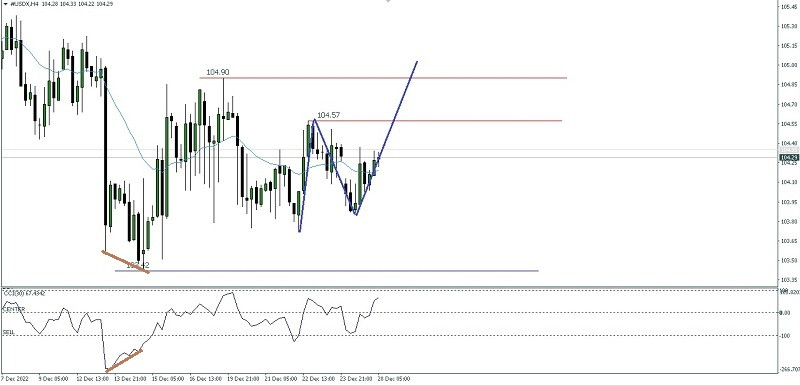
The United States Dollar Index on the 4-hour chart seems to be moving in ranging conditions in the range of 103.42-104.90 which has also been confirmed by the movement of the Moving Average which is moving in the range of the body of the Candlestick, this is understandable given that there are not many market participants. which is still in the Christmas and New Year holiday season but based on the CCI indicator which managed to break above the -100 level and above level 0 which indicates that the condition of Buyers is still more dominant than Sellers plus there is a deviation between price movements and the CCI indicator, it seems that in In the near future, USDX will try to test a level above its current price, namely 104.75 as its first target and 104.90 as its second target, but given the low volatility if USDX falls below the 103.72 level, it is very likely that the scenario described earlier will become invalid and cancel itself.
*The market analysis posted here is meant to increase your awareness, but not to give instructions to make a trade.
Analysis are provided by InstaForex.
Read More
-
29-12-2022, 05:02 AM #3735Senior Investor
- Join Date
- Jun 2012
- Posts
- 3,492
- Feedback Score
- 0
- Thanks
- 0
- Thanked 9 Times in 9 Posts
Forex Analysis & Reviews: Technical Analysis of Intraday Price Movements of Nasdaq 100 Index, Thursday December 29 2022.
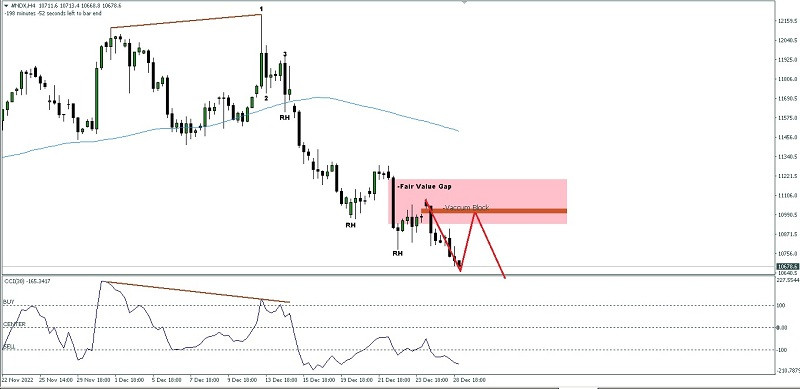
With the appearance of the deviation between Nasdaq 100 index price movements with the indicator as well as the price movement which is below the 100 Moving Average and the appearance of the Bearish 123 pattern which is followed by a break of Ross Hook (RH), it is certain that the #NDX condition is in a bearish situation which in the near future seems to be experiencing a slight upward correction to test the Vaccum Block area level the range 10993.7-11028.6 which happens to be also within the Bearish Fair Value Gap level area if the levels in this area function as resistance quite well and as long as the upward correction does not exceed above the 11233.6 level then #NDX will continue its decline back to the 10616.1 level as the first target and level 10433.8 as the second target.
*The market analysis posted here is meant to increase your awareness, but not to give instructions to make a trade.
Analysis are provided by InstaForex.
Read More
-
30-12-2022, 09:42 AM #3736Senior Investor
- Join Date
- Jun 2012
- Posts
- 3,492
- Feedback Score
- 0
- Thanks
- 0
- Thanked 9 Times in 9 Posts
Forex Analysis & Reviews: Elliott wave analysis of EUR/USD on December 30, 2022
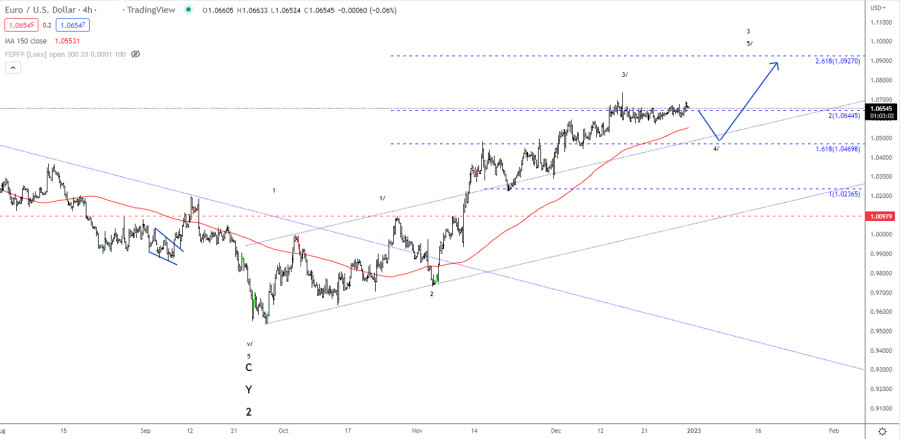
EUR/USD has been locked in a sideways consolidation, but we continue to look for a slightly deeper correction towards 1.0470 to complete wave 4/ and set the stage for wave 5/ higher to 1.0927 as this will complete wave 3.
In the longer term, we are looking for much higher levels for EUR/USD, but we will have to take the ride higher in baby steps as always as most of the time, the pair hovers within sideways consolidations and corrective counter-trends and only 1/3 of the time, it actually moves higher.
*The market analysis posted here is meant to increase your awareness, but not to give instructions to make a trade.
Analysis are provided by InstaForex.
Read More
-
02-01-2023, 12:44 PM #3737Senior Investor
- Join Date
- Jun 2012
- Posts
- 3,492
- Feedback Score
- 0
- Thanks
- 0
- Thanked 9 Times in 9 Posts
Forex Analysis & Reviews: EUR/USD analysis for January 02, 2023 - Rejection of the intraday support
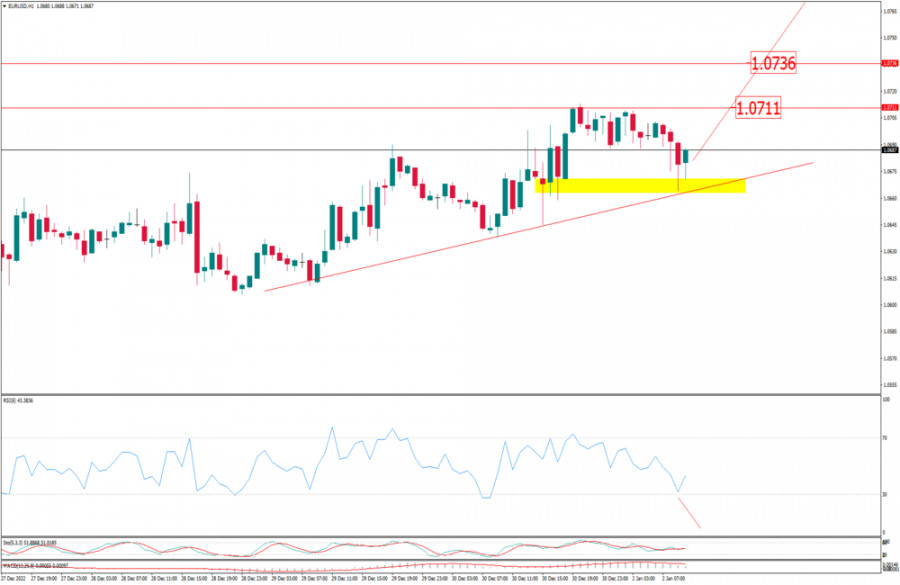
EUR/USD has been trading downside this morning but I found rejection of the key support zone, which is sign that there is chance for the upside movement.
Trading recommendation:
Due to the rejection of the rising trend-line and support zone at the price of 1.0665, I see potential for the upside movement towards upside references...
Watch for the potential buying opportunities on the intraday dips with the upside objectives at the price of 1.0710 and 1.0735
RSI oscillator is showing oversold condition, which is good sign for the further rally...
Key support is set at the price of 1.0665
*The market analysis posted here is meant to increase your awareness, but not to give instructions to make a trade.
Analysis are provided by InstaForex.
Read More
-
03-01-2023, 07:09 AM #3738Senior Investor
- Join Date
- Jun 2012
- Posts
- 3,492
- Feedback Score
- 0
- Thanks
- 0
- Thanked 9 Times in 9 Posts
Forex Analysis & Reviews: Technical Analysis of Daily Price Movement of GBP/USD Main Currency Pair, Tuesday Januari 03 2023
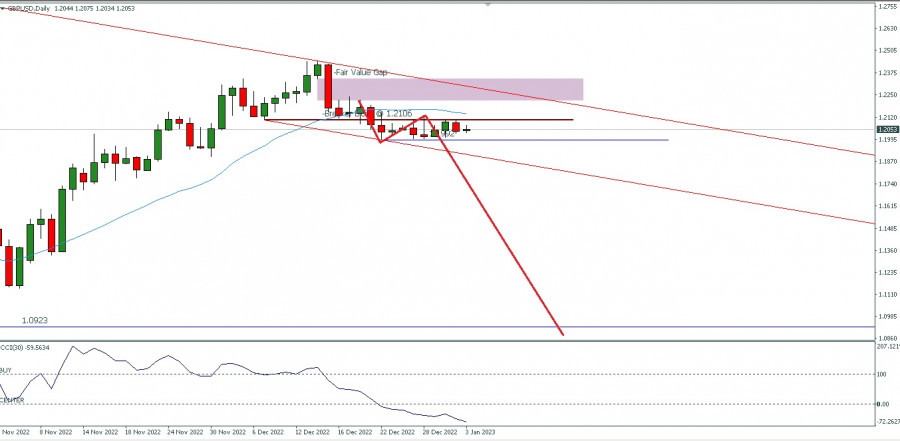
On the daily chart, the main currency pair GBP/USD appears to be moving in the Bearish channel and below the Moving Average. Just testing the Bearish Breaker Block level at 1.2106, Cable has the potential to depreciate in the next few days to the 1.1992 level and if this level is successfully penetrated by GBP/USD The USD has the potential to fall down to the 1.0923 level as long as it is on its way to the targets. There will be no significant upward correction, especially if it is broken above the 1.2426 level because if this level is successfully broken above, it will make all the scenarios previously described cancel automatically.
*The market analysis posted here is meant to increase your awareness, but not to give instructions to make a trade.
Analysis are provided by InstaForex.
Read More
-
04-01-2023, 06:46 AM #3739Senior Investor
- Join Date
- Jun 2012
- Posts
- 3,492
- Feedback Score
- 0
- Thanks
- 0
- Thanked 9 Times in 9 Posts
Forex Analysis & Reviews: Technical Analysis of Intraday Price Movements of Nasdaq 100 Index, Wednesday January 04 2023.
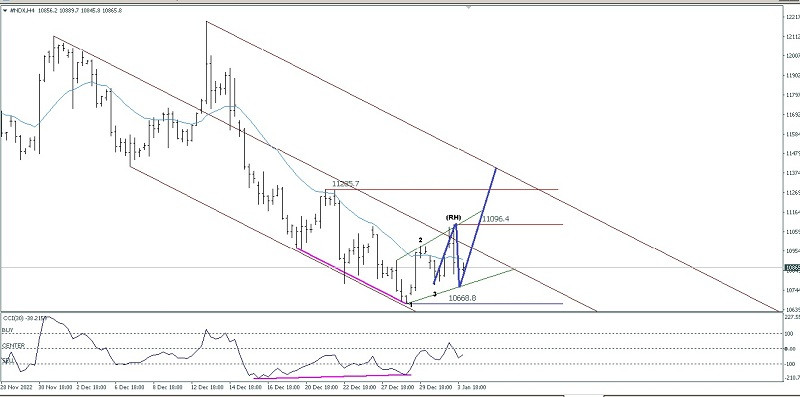
Nasdaq 100 Index on its 4 hour chart seems moving harmoniously inside Bearish Pitchfork Channel where this indicates that the Seller is still dominant in EUR/AUD but with the presence of deviations between price movements and the CCI indicator and the appearance of the Bullish 123 pattern followed by the appearance of the Ross Hook (RH) indicates that in the near future EUR/AUD will be corrected upwards where the Ross Hook (RH) level of 11096.4 will be the main target to be tested for this cross currency pair to be penetrated so that if this (RH) level is successfully broken above then the 11285.7 level will be the next target which will be tested by EUR/AUD but by because this upward correction causes an Ascending Broadening Wedge pattern to emerge, so please be careful. There will be a potential for EUR/AUD to continue the previous Bearish bias if suddenly EUR/AUD drops back down to past the 10668.8 level because if this level is successfully broken down, then the upward rally correction scenario described previously will become invalid and cancel by itself.
*The market analysis posted here is meant to increase your awareness, but not to give instructions to make a trade.
Analysis are provided by InstaForex.
Read More
-
05-01-2023, 09:22 AM #3740Senior Investor
- Join Date
- Jun 2012
- Posts
- 3,492
- Feedback Score
- 0
- Thanks
- 0
- Thanked 9 Times in 9 Posts
Forex Analysis & Reviews: EUR/USD analysis for January 05, 2023 - Triangle pattern in creation and potential for the upside continuation
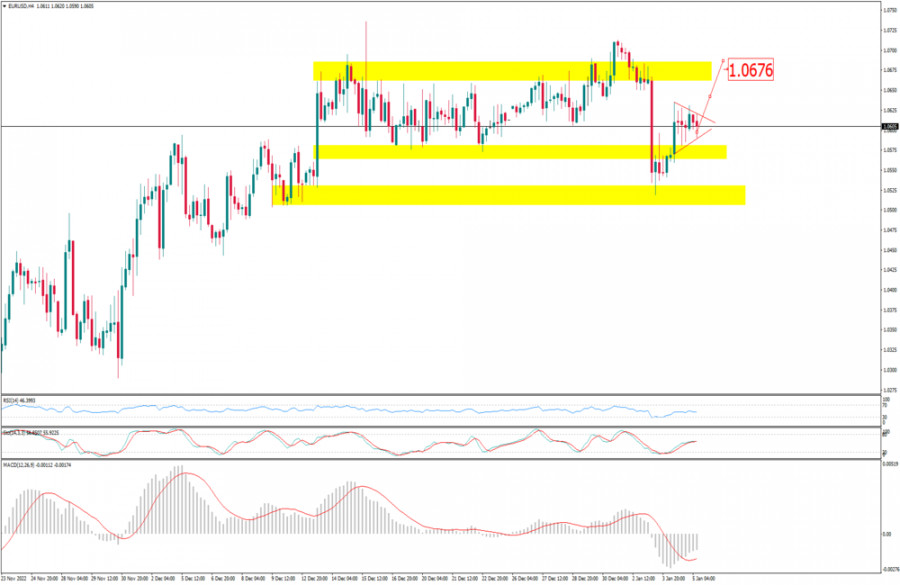
EUR/USD has been trading sideways at the price of 1.0608 and I see potential for the upside continuation towards upside reference.
Trading recommendation:
Due to the rejection of the key support zone in the background and symmetrical triangle pattern in creation, I see potential for the further growth.
Watch for the buying opportunities on the intraday dips with the upside objective at the price of 1.0675
Stochastic Oscillator is showing fresh bull cross, which is good sign for further rally
Key support zone is set at the price of 1.0520
*The market analysis posted here is meant to increase your awareness, but not to give instructions to make a trade.
Analysis are provided by InstaForex.
Read More
-
Sponsored Links


 Reply With Quote
Thread Information
Users Browsing this Thread
There are currently 1 users browsing this thread. (0 members and 1 guests)
 Posting Permissions
24 Hour Gold

Advertising
- Over 20.000 UNIQUE Daily!
- Get Maximum Exposure For Your Site!
- Get QUALITY Converting Traffic!
- Advertise Here Today!
Out Of Billions Of Website's Online.
Members Are Online From.
- Get Maximum Exposure For Your Site!
- Get QUALITY Converting Traffic!
- Advertise Here Today!
Out Of Billions Of Website's Online.
Members Are Online From.


