
 LinkBack URL
 About LinkBacks
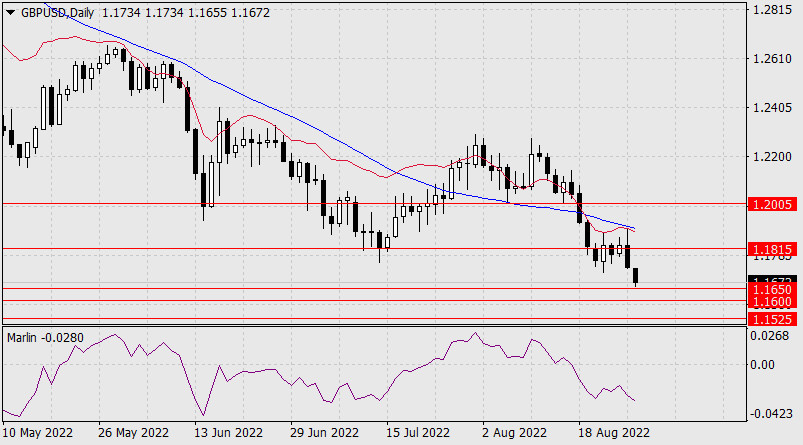
Forex Analysis & Reviews: Forecast for GBP/USD on August 29, 2022
Last Friday, the pound once again bounced as part of the upward correction from August 23, marking in the area where the balance and MACD indicator lines coincide on the daily scale chart and fell, closing the day with a loss of 94 points.
At the moment the price is testing the target level of 1.1650. Having overcome it, a close target at 1.1650 opens. Behind it is the 1.1525 target. The Marlin oscillator still has enough room ahead for an easy move before it enters the oversold zone.
The price settled below the indicator lines on the H4 chart, the Marlin Oscillator is falling in negative territory. The trend is downward. *The market analysis posted here is meant to increase your awareness, but not to give instructions to make a trade.
Analysis are provided by InstaForex.
Read More
Please visit our sponsors
Results 3,631 to 3,640 of 4086
Thread: InstaForex Wave Analysis
-
29-08-2022, 06:22 AM #3631Senior Investor


- Join Date
- Jun 2012
- Posts
- 3,492
- Feedback Score
- 0
- Thanks
- 0
- Thanked 9 Times in 9 Posts

-
30-08-2022, 06:12 AM #3632Senior Investor
- Join Date
- Jun 2012
- Posts
- 3,492
- Feedback Score
- 0
- Thanks
- 0
- Thanked 9 Times in 9 Posts
Forex Analysis & Reviews: AUDUSD Potential for Bearish Drop | 30th August 2022
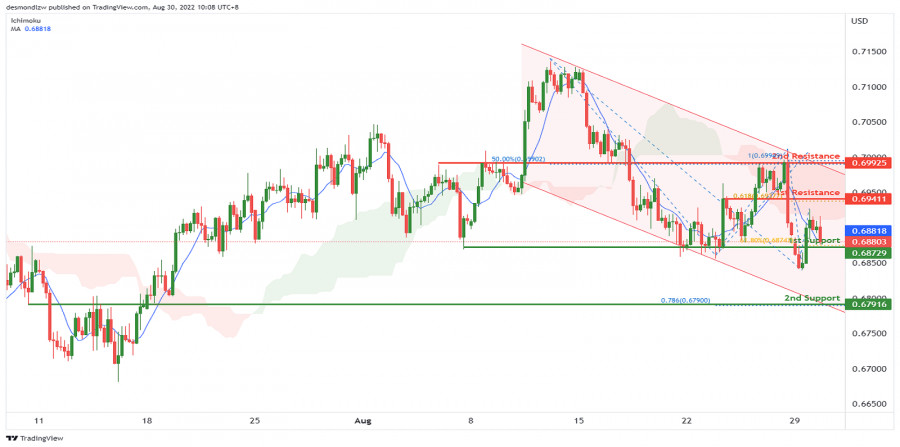
On the H4, with the price moving below the ichimoku cloud and moving within the descending channel, we have a bearish bias that the price may drop from the 1st support at 0.68729, which is in line with the swing lows and 61.8% fibonacci retracement to the 2nd support at 0.67916, where the overlap support and 78.6% fibonacci projection are. Alternatively, the price may rise to the 1st resistance at 0.69411, where the 61.8% fibonacci projection and previous swing high are. If the price can break this resistance level, we can expect the price to rise to the 2nd resistance at 0.69925, where the swing highs, 50% fibonacci retracement and 100% fibonacci projection are.
Trading Recommendation
Entry: 0.68729
Reason for Entry:Swing lows and 61.8% fibonacci retracement
Take Profit:0.67916
Reason for Take Profit: Overlap support and 78.6% fibonacci projection
Stop Loss: 0.69411
Reason for Stop Loss:
61.8% fibonacci projection and previous swing high
*The market analysis posted here is meant to increase your awareness, but not to give instructions to make a trade.
Analysis are provided by InstaForex
-
31-08-2022, 05:14 AM #3633Senior Investor

- Join Date
- Jul 2011
- Location
- www.ArmadaMarkets.com
- Posts
- 4,127
- Feedback Score
- 0
- Thanks
- 0
- Thanked 2 Times in 2 Posts
the choice of broker must be able to be considered carefully, this is done so that traders can be more leverage in getting maximum trading security and comfort like what I got from Tickmill.
-
31-08-2022, 06:34 AM #3634Senior Investor
- Join Date
- Jun 2012
- Posts
- 3,492
- Feedback Score
- 0
- Thanks
- 0
- Thanked 9 Times in 9 Posts
Forex Analysis & Reviews: AUDUSD Potential For Bearish Drop | 31st August 2022
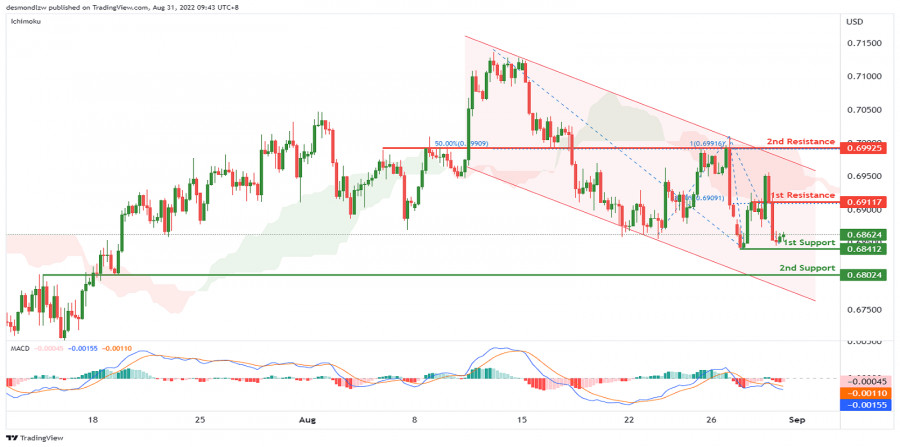
On the H4, with the price moving below the ichimoku cloud, moving within the descending channel and MACD is showing a death cross, we have a bearish bias that the price may drop to the 1st support at 0.68412, which is in line with the swing low to the 2nd support at 0.68024, where the overlap support is. Alternatively, the price may rise to the 1st resistance at 0.69118, where the 38.2% fibonacci retracement and previous swing high are. If the price can break this resistance level, we can expect the price to rise to the 2nd resistance at 0.69925, where the swing highs, 50% fibonacci retracement and 100% fibonacci projection are.
Trading Recommendation
Entry: 0.68412
Reason for Entry: Swing low
Take Profit: 0.68024
Reason for Take Profit: Overlap support
Stop Loss: 0.69118
Reason for Stop Loss:
38.2% fibonacci retracement and previous swing high
*The market analysis posted here is meant to increase your awareness, but not to give instructions to make a trade.
Analysis are provided by InstaForex.
Read More
-
01-09-2022, 06:29 AM #3635Senior Investor
- Join Date
- Jun 2012
- Posts
- 3,492
- Feedback Score
- 0
- Thanks
- 0
- Thanked 9 Times in 9 Posts
Forex Analysis & Reviews: Trading Signal for GBP/USD for September 1-2, 2022: buy in case of rebound at 1.1542 (-1/8 Murray - reversal pattern)
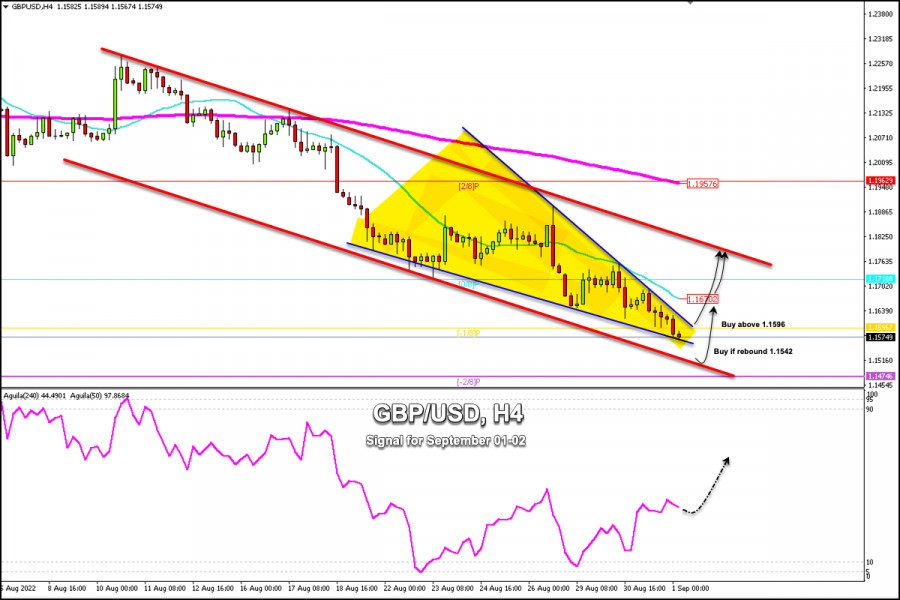
Early in the European session, the British Pound (GBP/USD) is trading at around 1.1574. We can see the formation of a symmetrical triangle on the 4-hour chart. If the pound manages to break above this pattern, we could expect a bullish acceleration towards the 21 SMA located at 1.1670.
The British pound is under downward pressure due to the gloomy outlook for the British economy.
Earlier this month, the Bank of England forecast that the British economy would enter a prolonged recession from the fourth quarter of 2022. This suggests that in the medium term the pound could reach the psychological level of 1.15 and even the low of 2020 at 1.1410.
The GBP/USD pair is trading below the 21 SMA located at 1.1670 and below the 200 EMA located at 1.1957. Any technical bounce towards these levels will be seen as an opportunity to sell.
On the 4-hour chart, we can see the formation of a downtrend channel since August 8. In case the downside pressure continues, a technical bounce around the bottom of the downtrend channel is expected around 1.1542.
Technically, GBP/USD is under strong bearish pressure and is trading around -1/8 of Murray at 1.1598. This Murray level represents a technical reversal zone.
In the event that the pound resumes its bullish cycle, we should expect it to trade above 1.1596 (-1/8 Murray), which could set the stage for a recovery in GBP and it could reach the top of the downtrend channel at around 1.1780.
On the other hand, if the pound continues its downward acceleration, it is expected to fall towards the area of around 1.1542. There is daily support and it could even reach -2/8 of Murray located at 1.1475.
Our trading plan for the next few hours suggests a sharp break above the symmetrical triangles pattern at around 1.1596 to buy with targets at 1.1670 and 1.1780. *The market analysis posted here is meant to increase your awareness, but not to give instructions to make a trade.
Analysis are provided by InstaForex.
Read More
-
02-09-2022, 03:17 AM #3636Senior Investor

- Join Date
- Dec 2019
- Posts
- 2,107
- Feedback Score
- 0
- Thanks
- 0
- Thanked 0 Times in 0 Posts
The selection of the existing broker must be able to be considered properly, this is done so that traders can be more leverage in getting the security and comfort of trading with Tickmill.
-
02-09-2022, 07:33 AM #3637Senior Investor
- Join Date
- Jun 2012
- Posts
- 3,492
- Feedback Score
- 0
- Thanks
- 0
- Thanked 9 Times in 9 Posts
Forex Analysis & Reviews: Technical Analysis of GBP/USD for September 2, 2022
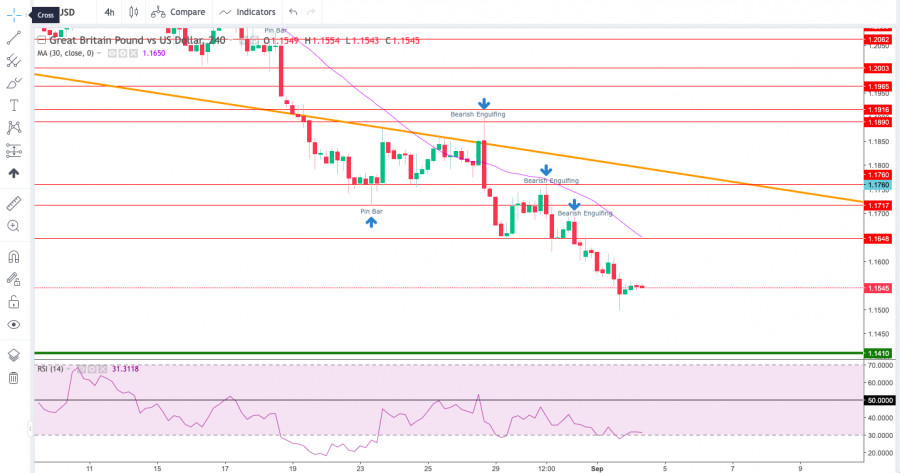
Technical Market Outlook:
The GBP/USD pair has made another fresh low at the level of 1.1498 and continues to move away from the trend line resistance. The nearest horizontal technical resistance is seen at the level of 1.1622 and this level is the next target for bulls in a case of a local pull-back. The next target for bears is located at the level of 1.1410 (2020 low). The momentum remains weak and negative on the H4 time frame chart, so the larger time frame trend (daily and weekly) remains down until further notice.
Weekly Pivot Points:
WR3 - 1.18043
WR2 - 1.17392
WR1 - 1.17002
Weekly Pivot - 1.16741
WS1 - 1.16351
WS2 - 1.16090
WS3 - 1.15439
Trading Outlook:
The Cable is way below 100 and 200 DMA , so the bearish domination is clear and there is no indication of down trend termination or reversal. The bulls has failed big time to continue the corrective cycle after a big Bearish Engulfing candlestick pattern was made on the weekly time frame chart last week. The next long term target for bears is seen at the level of 1.1410. Please remember: trend is your friend. *The market analysis posted here is meant to increase your awareness, but not to give instructions to make a trade.
Analysis are provided by InstaForex.
Read More
-
05-09-2022, 07:21 AM #3638Senior Investor
- Join Date
- Jun 2012
- Posts
- 3,492
- Feedback Score
- 0
- Thanks
- 0
- Thanked 9 Times in 9 Posts
Forex Analysis & Reviews: Elliott wave analysis of Litecoin for September 5, 2022
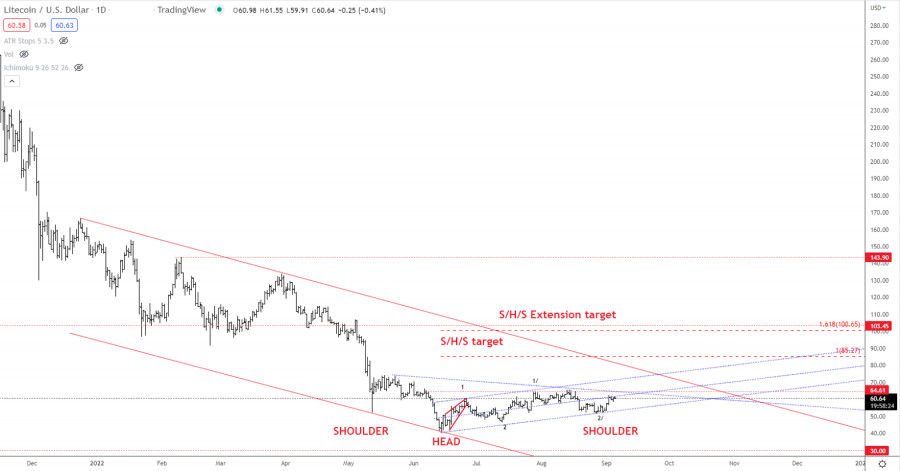
In late August, we pinpointed the possibility of a Shoulder- Head-Shoulder bottom being built. The right shoulder held support nicely and is now ready to test the neckline resistance at near 65.77. A break above here will activate the bottom formation for a rally towards 85.27 and possibly even closer to the extension target at 100.65.
However, a confirmed bottom could lead to much higher levels in the weeks/months ahead and 100.65 could only be a temporary stop on the way higher.
*The market analysis posted here is meant to increase your awareness, but not to give instructions to make a trade.
Analysis are provided by InstaForex.
Read More
-
06-09-2022, 06:28 AM #3639Senior Investor
- Join Date
- Jun 2012
- Posts
- 3,492
- Feedback Score
- 0
- Thanks
- 0
- Thanked 9 Times in 9 Posts
Forex Analysis & Reviews: Forecast for EUR/USD on September 6, 2022
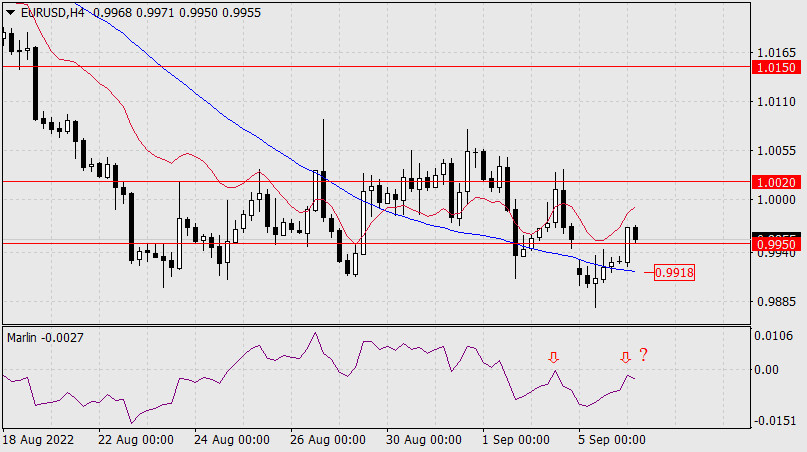
The euro closed Monday with a slight decrease, not having time to close the gap from the market opening. This was prevented by resistance at 0.9950. The line of the Marlin Oscillator, which forms the convergence, also showed noticeable resistance. This morning the resistance level is overcome, the gap is closed, the euro may resume its decline, but the oscillator is still struggling with the linear support hurdle.
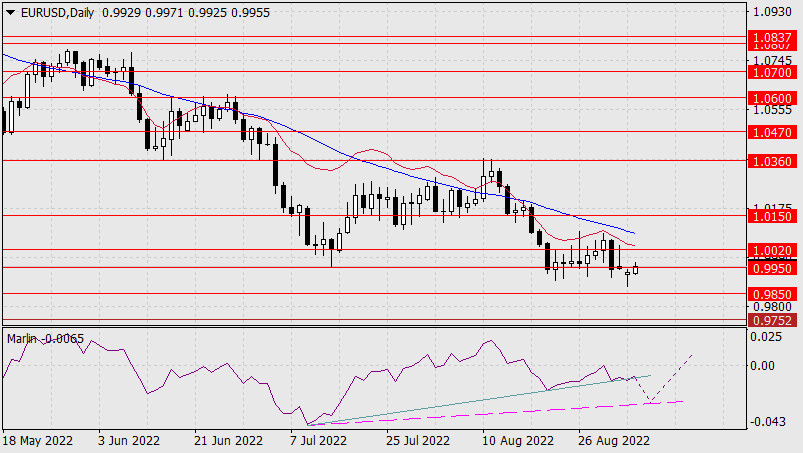
To develop a downward movement, the price needs to return under the level of 0.9950. Next, we are waiting for the target levels 0.9850 and 0.9752 to be worked out. The price is between the balance and MACD indicator lines on the H4 chart, the Marlin Oscillator is in the negative area. To consolidate the downward momentum after the price goes under 0.9950, it will also need to overcome the MACD line, approximately in the area of 0.9918. It is also possible for the price to move slightly upwards (0.9985) so that the signal line of the Marlin Oscillator reaches the zero line and reverses from it, thus forming a repeated reversal pattern. This main scenario will be broken if the price settles above the resistance level of 1.0020.
Analysis are provided by InstaForex.
Read More
-
07-09-2022, 07:25 AM #3640Senior Investor
- Join Date
- Jun 2012
- Posts
- 3,492
- Feedback Score
- 0
- Thanks
- 0
- Thanked 9 Times in 9 Posts
Forex Analysis & Reviews: Trading Signal for GBP/USD for September 7-8, 2022: buy above 1.1474 or 1.1385 (-1/8 Murray - 21 SMA)
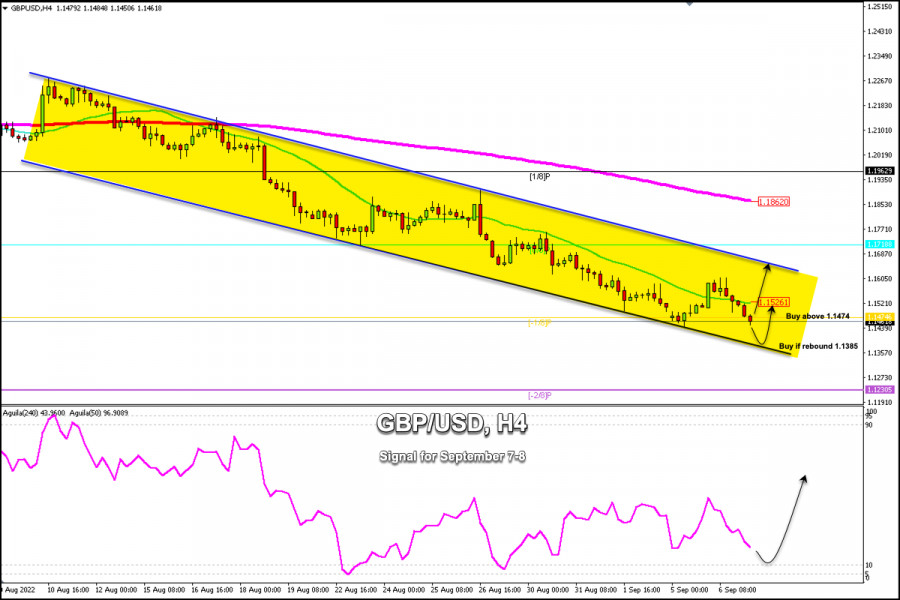
Early in the European session, the British pound is trading at around 1.1461. GBP/USD is under strong downward pressure. It is likely that if the pair continues to decline, a technical bounce could occur around the bottom of the downtrend channel at 1.1385.
The British pound is trading below the 21 SMA and below -1/8 Murray. As long as it continues to trade within the downtrend channel, GBP/USD is expected to continue its decline and could reach the extremely oversold zone around -2/8 Murray at 1.1230. One factor that keeps the pound weak is that investors are concerned about a possible recession in the UK economy.
According to the daily chart, the GBP/USD pair is entering oversold levels. So, a technical bounce is likely in the coming hours if the pound manages to consolidate above -1/8 Murray located at 1.1474.
On the other hand, a sharp break of the downtrend channel formed since the beginning of August could offer a sustained recovery for the pound and it could even reach the 0/8 Murray area at 1.1718 and could even reach the 200 EMA located at 1.1862.
Conversely, should the pound break the downtrend channel at around 1.1385, it could accelerate its decline below towards the zone of -2/8 Murray at 1.1230.
Our trading plan for the next few hours for GBP/USD is to wait for its consolidation at around 1.1384 to buy or wait for it to consolidate above 1.1474 (-1/8 Murray) and above the 21 SMA around 1.1526 to buy. Above these levels, we expect the British pound to reach the levels of 1.1605 and 1.1718.
*The market analysis posted here is meant to increase your awareness, but not to give instructions to make a trade.
Analysis are provided by InstaForex.
Read More
-
Sponsored Links


 Reply With Quote
Thread Information
Users Browsing this Thread
There are currently 1 users browsing this thread. (0 members and 1 guests)
 Posting Permissions
24 Hour Gold

Advertising
- Over 20.000 UNIQUE Daily!
- Get Maximum Exposure For Your Site!
- Get QUALITY Converting Traffic!
- Advertise Here Today!
Out Of Billions Of Website's Online.
Members Are Online From.
- Get Maximum Exposure For Your Site!
- Get QUALITY Converting Traffic!
- Advertise Here Today!
Out Of Billions Of Website's Online.
Members Are Online From.


