
 LinkBack URL
 About LinkBacks
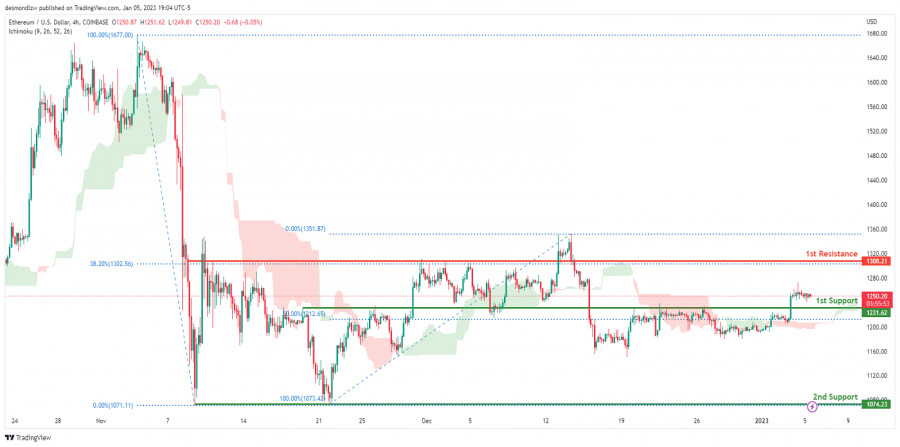
Forex Analysis & Reviews: ETHUSD Potential For Bearish Drop | 6th January 2023
Looking at the H4 chart, my overall bias for ETHUSD is bullish due to the current price crossing above the Ichimoku cloud, indicating a bullish market. If this bullish momentum continues, expect the price to head towards the 1st resistance at 1308.21, where the 38.2% Fibonacci line is. In an alternative scenario, price could head back down towards the 1st support at 1231.62, where the 50% Fibonacci line is.
Trading Recommendation
Entry: 1308.21
Reason for Entry: Retest 1st resistance line
Take Profit:1231.62
Reason for Take Profit: 1st support line
Stop Loss: 1351.87
Reason for Stop Loss:
Recent swing high
*The market analysis posted here is meant to increase your awareness, but not to give instructions to make a trade.
Analysis are provided by InstaForex.
Read More
Please visit our sponsors
Results 3,741 to 3,750 of 4086
Thread: InstaForex Wave Analysis
-
06-01-2023, 06:47 AM #3741Senior Investor


- Join Date
- Jun 2012
- Posts
- 3,492
- Feedback Score
- 0
- Thanks
- 0
- Thanked 9 Times in 9 Posts

-
09-01-2023, 06:16 AM #3742Senior Investor
- Join Date
- Jun 2012
- Posts
- 3,492
- Feedback Score
- 0
- Thanks
- 0
- Thanked 9 Times in 9 Posts
Forex Analysis & Reviews: Forecast for EUR/USD on January 9, 2023
The dollar's first rush to a massive strengthening across the board since trading opened in the new year was wiped out by Friday's surge in counter-dollar currencies and the return of risk appetite to the markets - stock markets have already exceeded their pre-New Year's values.
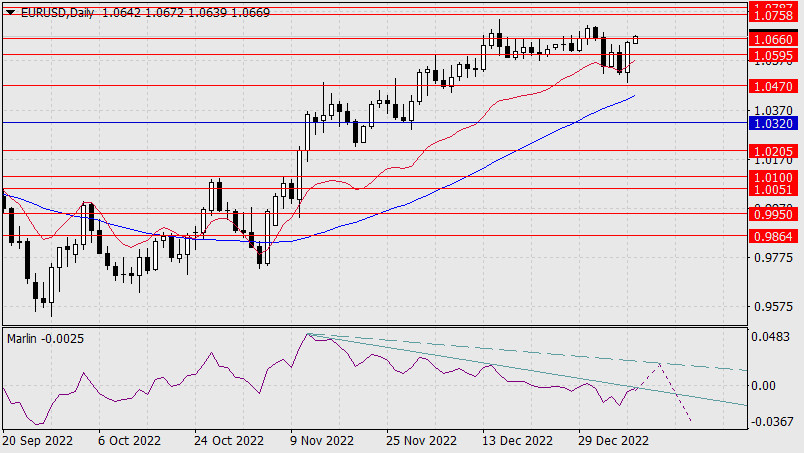
The euro rose 125 pips on Friday, which is one of the signs that the bearish correction is over, but until the price settles over the range of 1.0595-1.0660 and the signal line of the Marlin oscillator on the daily chart falls to the positive area, it is too premature to change the reversal strategy.
The second scenario, with the formation of a complex extended divergence, which we considered in mid-December, gets an upgraded look - the reversal from the support area of 1.0470 while reaching the target range of 1.0758-1.0787. On the daily chart, it is marked with the dashed lines.
At the moment, under the main scenario, we expect completion of the correction in the range of 1.0595-1.0660 and a movement below 1.0470, which will also mean the price will move under the MACD indicator line.
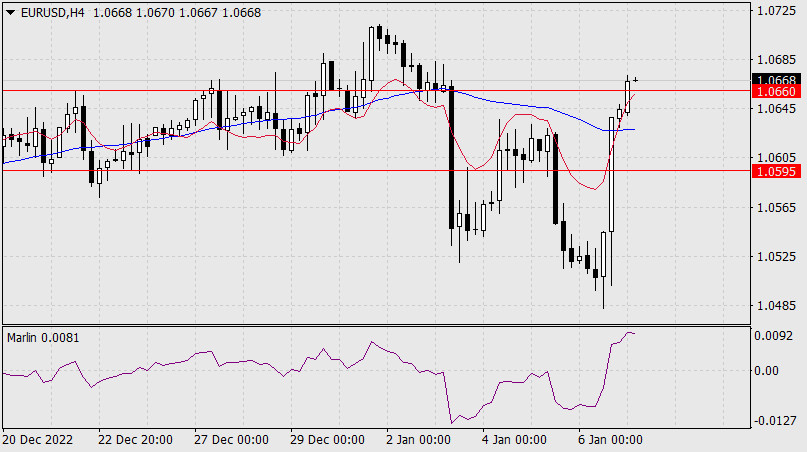
On the four-hour chart, the price settled above the MACD line, the Marlin has settled in the positive area, and the situation changes into which the euro could rise. But the price and the oscillator are not settling on the daily chart, so the output on the four-hour chart may be false.
*The market analysis posted here is meant to increase your awareness, but not to give instructions to make a trade.
Analysis are provided by InstaForex.
Read More
-
10-01-2023, 05:10 AM #3743Senior Investor
- Join Date
- Jun 2012
- Posts
- 3,492
- Feedback Score
- 0
- Thanks
- 0
- Thanked 9 Times in 9 Posts
Forex Analysis & Reviews: ECB hopes for strong wage growth as support for rate hikes

The European Central Bank forecasts wage growth to be very strong in the coming quarters, strengthening the case for further rate hikes. In an Economic Bulletin article published on Monday, the bank said wage growth has been "relatively moderate" since the start of the pandemic, but is now close to its long-term trend. And, over the next few quarters, it is expected to be very strong compared to historical patterns. "This reflects resilient labor markets, which so far have not been significantly affected by the economic slowdown, an increase in the national minimum wage and some lag between wages and the high rate of inflation," the article explained.
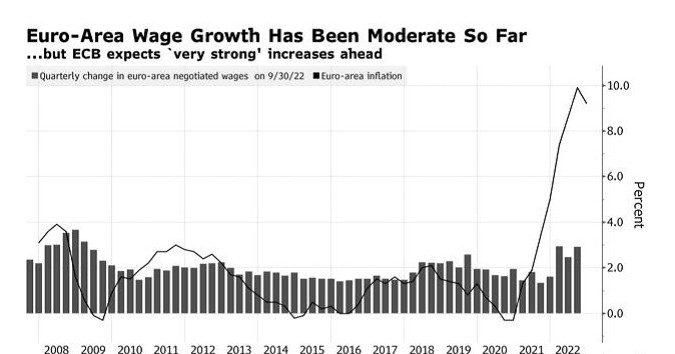
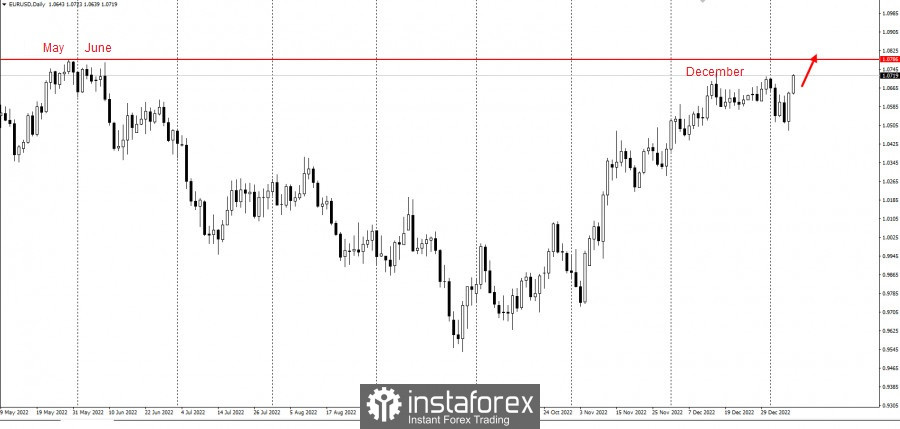
Over the last 1.5 years, price growth has exceeded the ECB's target of 2%. There is a chance that it will exceed 10% at the end of 2022 as the core inflation indicator, which excludes volatile goods such as food and energy, reached a record high in December. With forecasts showing that 2% inflation will not be achievable before the end of 2025 and unions pushing for generous compensation packages, the ECB conducted an unprecedented series of rate hikes, pushing the deposit rate up to 2% last month. Against this backdrop, EUR/USD continued to rally, approaching the top of May-June last year.
To avoid a wage and price spiral, ECB chief Christine Lagarde flagged another half-point hike at the February meeting. After all, weaker economic growth is unlikely to help in the near term, especially as a shortage of skilled labor encourages businesses to retain workers and pay them well. ECB chief economist Philip Lane noted that it will take several years for wages to fully adjust to the recent shocks, but "there are signs of stronger wage growth in the service sector", primarily in those where there is a shortage of staff. However, the expected slowdown in economic growth in the euro area and uncertainty about the economic outlook are likely to put downward pressure in the near term.
*The market analysis posted here is meant to increase your awareness, but not to give instructions to make a trade.
Analysis are provided by InstaForex.
Read More
-
11-01-2023, 07:16 AM #3744Senior Investor
- Join Date
- Jun 2012
- Posts
- 3,492
- Feedback Score
- 0
- Thanks
- 0
- Thanked 9 Times in 9 Posts
Forex Analysis & Reviews: Technical Analysis of Daily Price Movement of USD/JPY Main Currency Pairs, Wednesday January 11 2023.
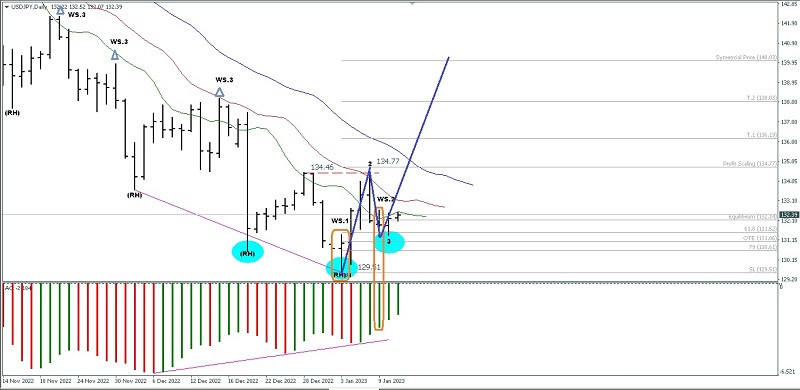
If we look at 4 hour chart USD/JPY main currency pairs looks like the following facts:
1. There is a deviation between price movements with Awesome Oscillator Indicator.
2. The form of Bullish 123 pattern.
3. The appearance of Wiseman. 1 (Bullish Divergent Bar).
4. The appearance of Wiseman. 2 (SAO).
Based on the four facts above, in the coming days the main currency pair USD/JPY has the potential to appreciate, rally upwards to test the 134.77 level. If it is successfully penetrated, USD/JPY will continue its rally up to the 136.19 level and if momentum and volatility are supportive then USD/JPY will continue its rally up to the level of the 138.03-140.03 area but if on its way to the targets of this area suddenly USD/JPY reverses back to its initial bias (Bearish) to break below the 129.51 level then all the scenarios previously described will become invalid and cancel by itself.
*The market analysis posted here is meant to increase your awareness, but not to give instructions to make a trade.
Analysis are provided by InstaForex.
Read More
-
12-01-2023, 05:59 AM #3745Senior Investor
- Join Date
- Jun 2012
- Posts
- 3,492
- Feedback Score
- 0
- Thanks
- 0
- Thanked 9 Times in 9 Posts
Forex Analysis & Reviews: Technical Analysis of Intraday Movement of USD/MXN Currency Pairs, Thursday January 12, 2023.
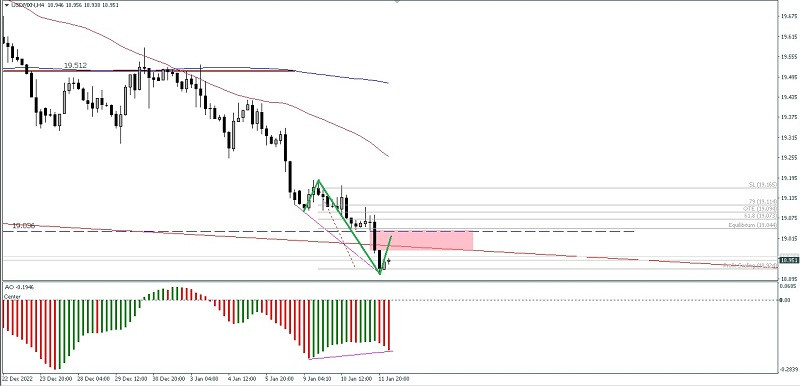
The USD/MXN currency pair on the 4-hour chart appears to be trying to correct a rally upwards after successfully breaking below the 19,036 level where this is confirmed by the appearance of deviations between price movements and the Awesome Oscillator indicator. The level to be tested in the near future is the area 18,980-19,039 but if before successfully heading to that area level suddenly USD/MXN moves down again to break below the 18,911 level then it is very likely that the scenario described earlier will become invalid and cancel itself.
*The market analysis posted here is meant to increase your awareness, but not to give instructions to make a trade.
Analysis are provided by InstaForex.
Read More
-
13-01-2023, 11:38 AM #3746Senior Investor
- Join Date
- Jun 2012
- Posts
- 3,492
- Feedback Score
- 0
- Thanks
- 0
- Thanked 9 Times in 9 Posts
Forex Analysis & Reviews: Analysis of Gold for January 13,.2023 - Breakout of the trading range
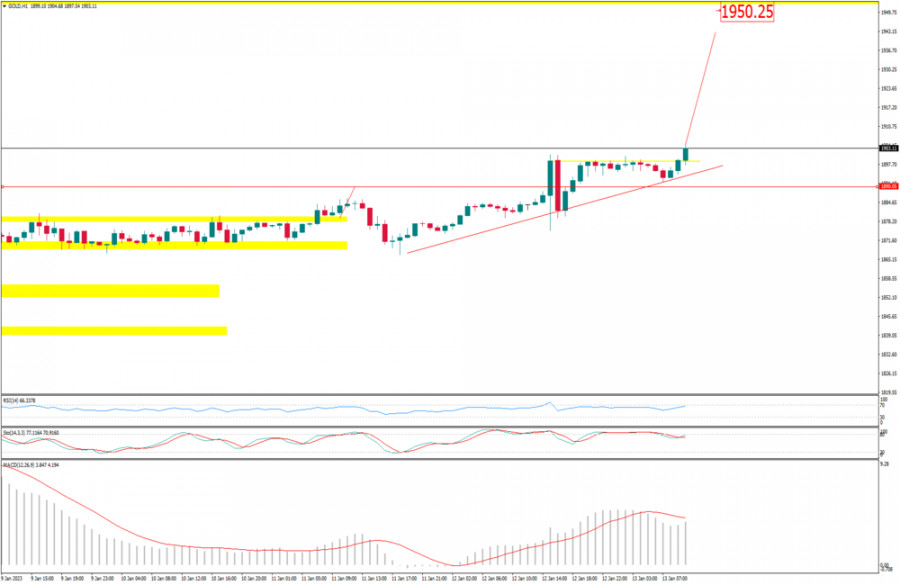
Gold has been trading upside as I expected and the price has reached the first upside objective at the price of $1.900. Anyway, I see potential for further upside movement due to the strong upside momentum.
Trading recommendation:
Due to the strong upside pressure and the breakout of the resistance zone at $1.900, I see potential for the further upside movement towards next upside reference.
Watch for the potential buying opportunities on the intraday dips with the upside objective at the price of $1.950.
MACD oscillator is showing fresh upside momentum, which is strong sign that buyers are in control. Key support is set at the price of $1.900
*The market analysis posted here is meant to increase your awareness, but not to give instructions to make a trade.
Analysis are provided by InstaForex.
Read More
-
16-01-2023, 06:21 AM #3747Senior Investor
- Join Date
- Jun 2012
- Posts
- 3,492
- Feedback Score
- 0
- Thanks
- 0
- Thanked 9 Times in 9 Posts
Forex Analysis & Reviews: Forecast for USD/JPY on January 16, 2023
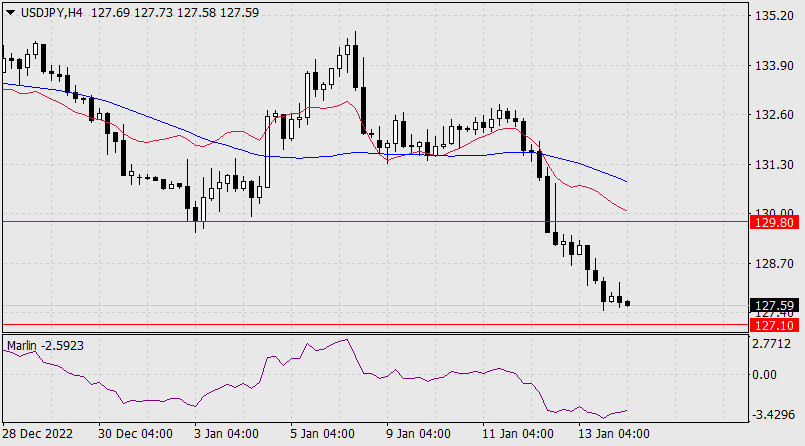
The declining trend of the USD/JPY pair and the rising trend of the Marlin oscillator dragged on in a counter move. Taking into consideration the fact that the oscillator is leading, as well as historical data, showing a price reversal following the established trend of the oscillator, I expect the pair to rise, at least a significant correction, from the entire decline since October 21, 2022.
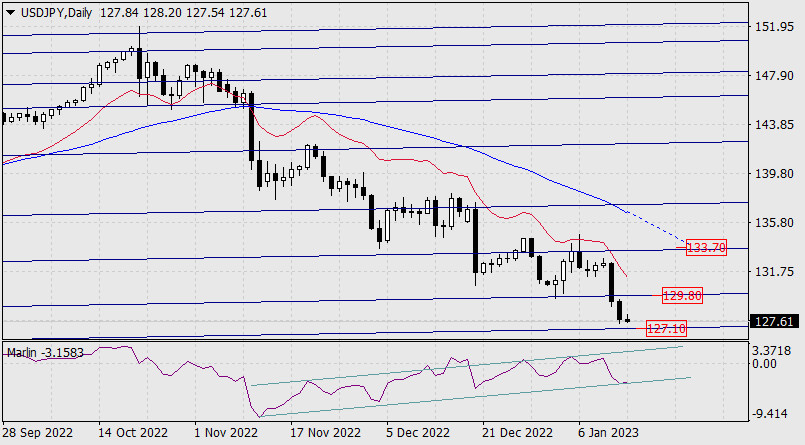
If there are no surprises, the reversal will occur from the nearest support at 127.10, which we can see on the daily chart. The first growth target will be the nearest enclosed line of the price channel around 129.80. Crossing it opens the way to the next line (133.70), which is close to the MACD indicator line. The MACD line acts as an independent level of support and resistance, if it coincides with any other graphic line, reinforcing it.
On the four-hour chart, there is a reversal of the Marlin oscillator. There are no other signs of reversal. But while these signs are forming, the price can still manage to reach the support 127.10.
*The market analysis posted here is meant to increase your awareness, but not to give instructions to make a trade.
Analysis are provided by InstaForex.
Read More
-
17-01-2023, 07:38 AM #3748Senior Investor
- Join Date
- Jun 2012
- Posts
- 3,492
- Feedback Score
- 0
- Thanks
- 0
- Thanked 9 Times in 9 Posts
Forex Analysis & Reviews: Forecast for EUR/USD on January 17, 2023
As we expected in yesterday's review, due to the US holiday, the euro moved sideways, confirming the consolidation above the target range of 1.0758/87. But over the past 24 hours important nuances appeared, while the main idea of the price breakdown of t1.0990 is preserved.
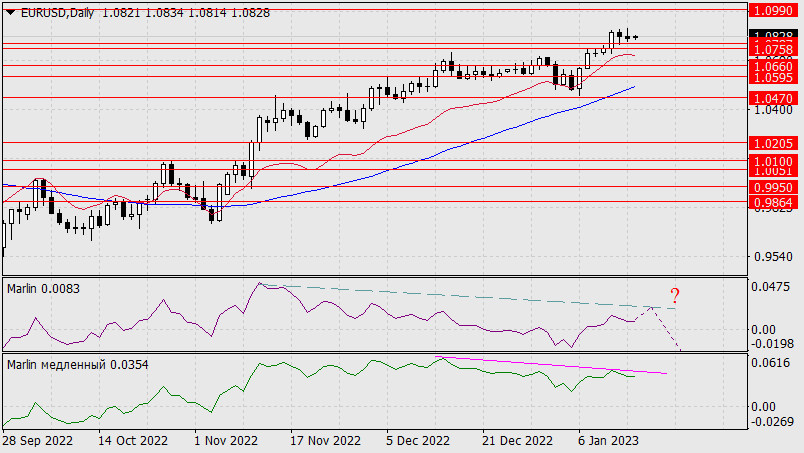
Our traditional Marlin oscillator still has the potential to form a renewed flat divergence, which is marked with a dotted line, and the so-called slow Marlin managed to form a traditional divergence, which increases the probability of a price reversal from the current levels. This will be confirmed once the price crosses the lower limit of the support range at 1.0758/87. Crossing yesterday's high at 1.0874 will push the pair to rise towards the target at 1.0990.
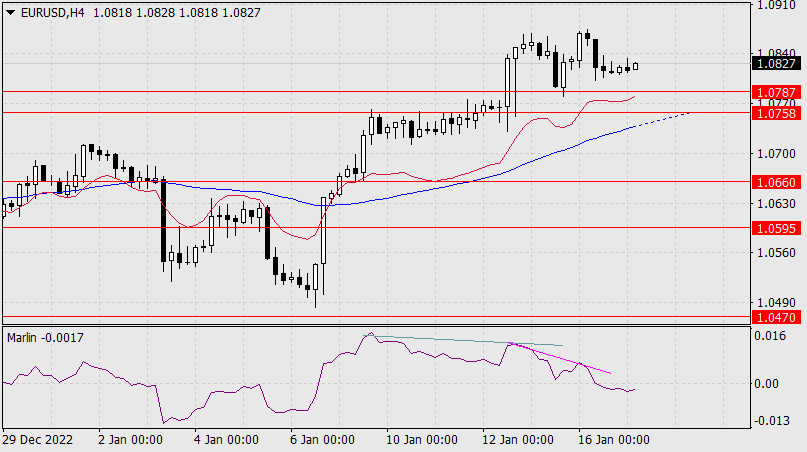
On the four-hour chart, under the pressure of a double divergence, the signal line went under the zero line, into the area of the downtrend. Now the price will be under pressure in the short-term. On the current chart, we see that crossing the lower limit of the range at 1.0758 coincides with crossing the MACD indicator line, and this will enhance the signal for further downward movement. We wait for the development of events.
*The market analysis posted here is meant to increase your awareness, but not to give instructions to make a trade.
Analysis are provided by InstaForex.
Read More https://ifxpr.com/3ZDNZTY
-
18-01-2023, 06:16 AM #3749Senior Investor
- Join Date
- Jun 2012
- Posts
- 3,492
- Feedback Score
- 0
- Thanks
- 0
- Thanked 9 Times in 9 Posts
Forex Analysis & Reviews: Technical Analysis of Daily Price Movement of AUD/JPY Currency Pairs, Wednesday January 18, 2023
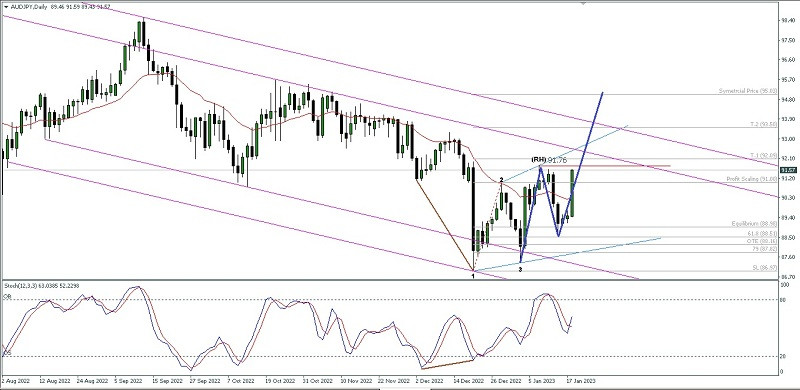
It can be seen clearly on the daily chart that the AUD/JPY currency pair is moving in a downward channel which means the bias is still bearish but currently it is corrected upwards especially since the emergence of the Bullish 123 pattern which was followed by the appearance of the Ross Hook where this level will be tested in the near future. tested by AUD/JPY so that if the 91.76 level is successfully penetrated above it then AUD/JPY in the next few days has the potential to appreciate up to the 93.50 level as the main target and the 95.03 level will be the next target to be tested but please pay attention to the emergence of the AUD Ascending Broadening Wedge pattern /JPY has the potential to fall back to its main bias (Bearish) where if the 86.97 level is penetrated below then all scenarios of an upward rally that have been described previously will become invalid.
*The market analysis posted here is meant to increase your awareness, but not to give instructions to make a trade.
Analysis are provided by InstaForex.
Read More
-
19-01-2023, 06:17 AM #3750Senior Investor
- Join Date
- Jun 2012
- Posts
- 3,492
- Feedback Score
- 0
- Thanks
- 0
- Thanked 9 Times in 9 Posts
Forex Analysis & Reviews: Technical Analysis of Daily Price Movement of Silver Commodity Asset, Thursday January 19 2023.
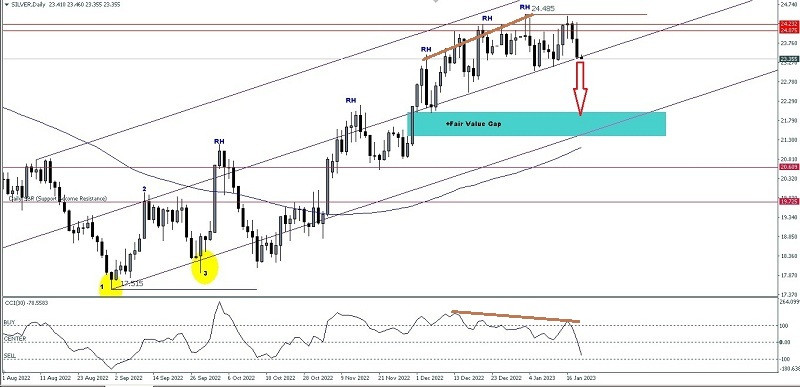
If we look at the 24,075-24,232 area level on the daily chart of commodity assets, Silver seems to function as a quite strong and significant resistance area because it is difficult for Silver to penetrate upwards where failure to penetrate above that level area creates Hagopian Rules conditions for this commodity asset that is in the channel. Bullish Pitchfork so that in the next few days Silver has the potential to fall corrected down to the level of the 22,010 - 21,400 area unless on the way down it suddenly Silver starts to rally again up significantly to break above the 24,485 level then the downside correction scenario described just now will become null and cancel by itself.
*The market analysis posted here is meant to increase your awareness, but not to give instructions to make a trade.
Analysis are provided by InstaForex.
Read More
-
Sponsored Links


 Reply With Quote
Thread Information
Users Browsing this Thread
There are currently 1 users browsing this thread. (0 members and 1 guests)
 Posting Permissions
24 Hour Gold

Advertising
- Over 20.000 UNIQUE Daily!
- Get Maximum Exposure For Your Site!
- Get QUALITY Converting Traffic!
- Advertise Here Today!
Out Of Billions Of Website's Online.
Members Are Online From.
- Get Maximum Exposure For Your Site!
- Get QUALITY Converting Traffic!
- Advertise Here Today!
Out Of Billions Of Website's Online.
Members Are Online From.


