
 LinkBack URL
 About LinkBacks
Forex Analysis & Reviews: Forecast for USD/JPY on August 9, 2022
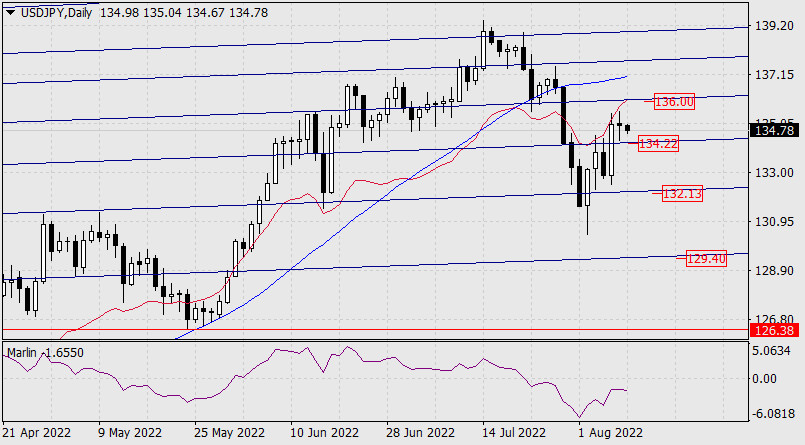
The USD/JPY pair formed a candle with a small body (-6 points) and sweeping shadows on Monday, which creates a sign of a reversal of the growing trend, that is, a sign of the end of the corrective growth from August 2. The reversal will be confirmed by the price dropping below the nearest support of the embedded price channel line at 134.22. The target will open on the underlying embedded line at 132.13.
The Marlin Oscillator is turning down, being in the downward trend zone. An alternative scenario assumes the price's succeeding growth with the 136.00 target. But a sign of such an alternative will be when the price overcomes yesterday's high at 135.57, which is close enough to the target itself, so in the current situation, the best strategy will be to wait for a sell signal, whether it will happen today or in a few days.
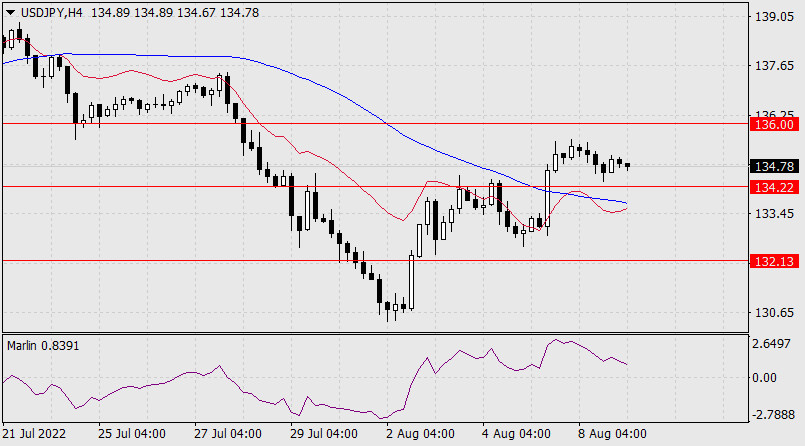
The price is approaching the support at 134.22 supported by the rapidly declining Marlin Oscillator on the 4-hour chart. The advance of the oscillator in the current situation means that it tends to move into the negative area before the price approaches the MACD line, since the price will already need technical assistance to overcome this support by that time. Ultimately, we are waiting for the price at the nearest target level of 132.13.
*The market analysis posted here is meant to increase your awareness, but not to give instructions to make a trade.
Analysis are provided by InstaForex.
Read More
Please visit our sponsors
Results 3,611 to 3,620 of 4086
Thread: InstaForex Wave Analysis
-
09-08-2022, 06:09 AM #3611Senior Investor


- Join Date
- Jun 2012
- Posts
- 3,492
- Feedback Score
- 0
- Thanks
- 0
- Thanked 9 Times in 9 Posts

-
10-08-2022, 06:47 AM #3612Senior Investor
- Join Date
- Jun 2012
- Posts
- 3,492
- Feedback Score
- 0
- Thanks
- 0
- Thanked 9 Times in 9 Posts
Forex Analysis & Reviews: USDCAD Potential for Bullish Rise | 10th August 2022
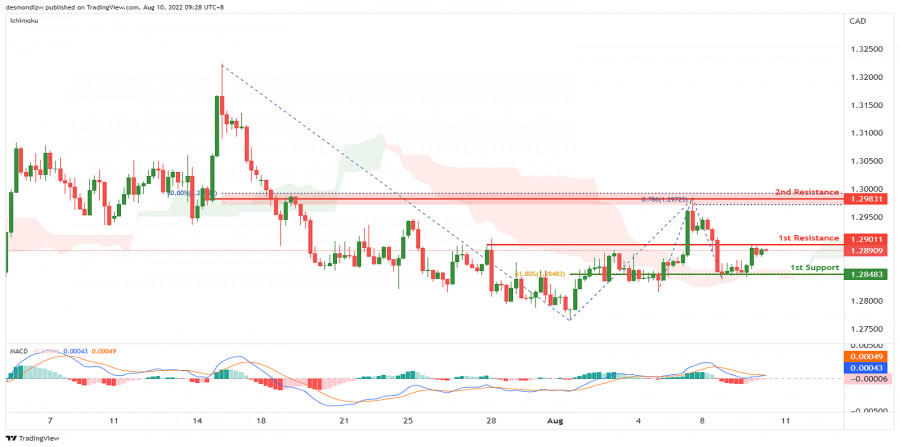
On the H4, with the price going above ichimoku cloud, and DIF is breaking the signal line in MACD, we have a bullish bias that the price may rise from our 1st resistance at 1.29011, which is in line with previous swing high to our 2nd resistance at 1.29831, which is in line with the 78.6% fibonacci projection and 50% fibonacci retracement. Alternatively, the price may drop to the 1st support at 1.28483, which is in line with 61.8% fibonacci retracement and pullback support.
Trading Recommendation
Entry:1.29011
Reason for Entry:Swing high
Take Profit: 1.29831
Reason for Take Profit: 78.6% fibonacci projection and 50% fibonacci retracement
Stop Loss: 1.28483
Reason for Stop Loss:
61.8% fibonacci retracement and pullback support
*The market analysis posted here is meant to increase your awareness, but not to give instructions to make a trade.
Analysis are provided by InstaForex.
Read More
-
11-08-2022, 03:39 AM #3613Senior Investor

- Join Date
- Dec 2019
- Posts
- 2,108
- Feedback Score
- 0
- Thanks
- 0
- Thanked 0 Times in 0 Posts
Existing analytical skills must be able to be considered properly, this is done so that traders can become more leverage in surviving and can become traders of the month together with Tickmill.
-
11-08-2022, 06:50 AM #3614Senior Investor
- Join Date
- Jun 2012
- Posts
- 3,492
- Feedback Score
- 0
- Thanks
- 0
- Thanked 9 Times in 9 Posts
Forex Analysis & Reviews: USDCHF Potential for Bearish Drop | 11st August 2022
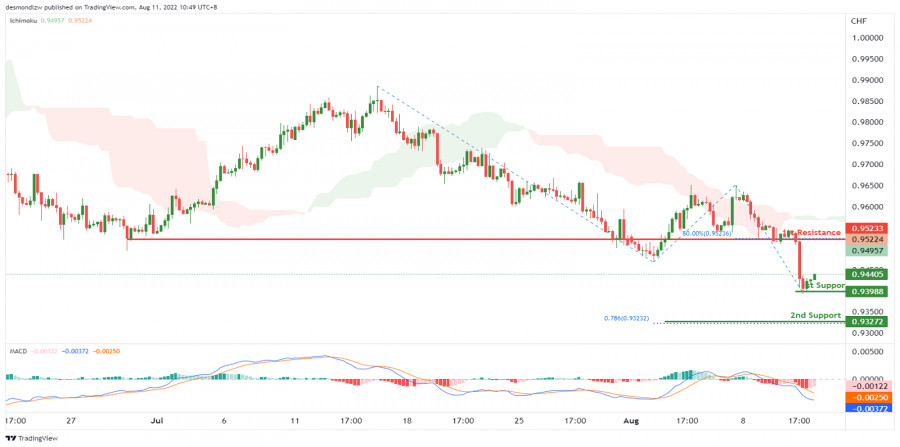
On the H4, with prices moving below the ichimoku cloud and the MACD indicators are below zero, we have a bearish bias that the price may drop from the 1st support at 0.94002, where the swing low support is to the 2nd support at 0.93272, which is in line with 78.6% fibonacci projection. Alternatively, since the price is rising currently and from H1, the DIF is crossing over the signal line, the price may rise to the 1st resistance at 0.95233, where the swing low support and 50% fibonacci retracement are.
Trading Recommendation Entry:0.94002
Reason for Entry: Swing low support
Take Profit: 0.93272
Reason for Take Profit: 78.6% fibonacci projection
Stop Loss: 0.95233
Reason for Stop Loss:
Swing low support and 50% fibonacci retracement
*The market analysis posted here is meant to increase your awareness, but not to give instructions to make a trade.
Analysis are provided by InstaForex.
Read More
-
12-08-2022, 06:20 AM #3615Senior Investor
- Join Date
- Jun 2012
- Posts
- 3,492
- Feedback Score
- 0
- Thanks
- 0
- Thanked 9 Times in 9 Posts
Forex Analysis & Reviews: Forecast for EUR/USD on August 12, 2022
Yesterday, the euro once again tried to attack the resistance level of 1.0360 (June 15 low), the attempt was unsuccessful, the pullback intensified. The Marlin Oscillator is already turning down in the positive area, and the price needs to overcome the support of the MACD indicator line (1.0222) and then the euro will begin to fall in the medium term. The first target is 1.0150.
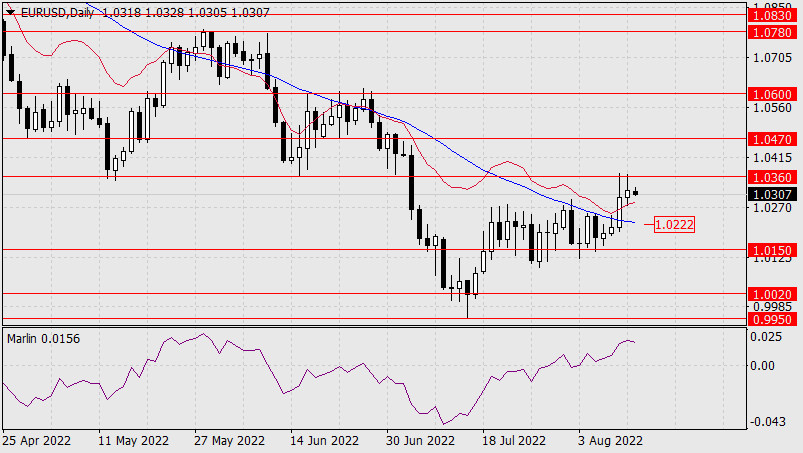
Federal Reserve FOMC members Neil Kashkari and Mary Daly (until recently a dove) announced the US central bank's firm intention to raise rates by 0.75% in September. The yield on 5-year US government bonds rose from 2.92% to 2.99%, breaking Monday's high.
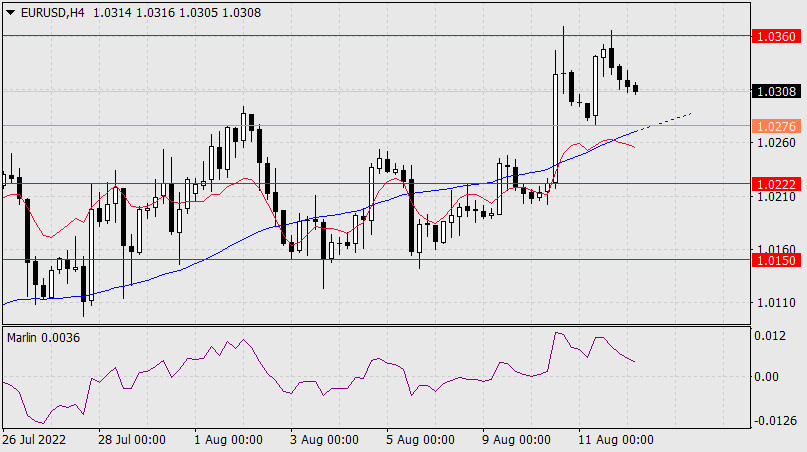
The Marlin Oscillator is leading the price down on the four-hour chart. The price itself tends to overcome the support of the MACD line (1.0276), which coincides with yesterday's low. It is very possible that the price will move below 1.0276 and the Marlin Oscillator into negative territory at the same time. In this case, the euro will receive a strong downward momentum with further downward development.
Analysis are provided by InstaForex.
Read More
-
15-08-2022, 04:57 AM #3616Senior Investor

- Join Date
- Jul 2011
- Location
- www.ArmadaMarkets.com
- Posts
- 4,127
- Feedback Score
- 0
- Thanks
- 0
- Thanked 2 Times in 2 Posts
Existing analytical skills will be very much needed by traders, this is done so that traders can be more leverage in getting the security and comfort of trading together with Tickmill.
-
15-08-2022, 07:37 AM #3617Senior Investor
- Join Date
- Jun 2012
- Posts
- 3,492
- Feedback Score
- 0
- Thanks
- 0
- Thanked 9 Times in 9 Posts
Forex Analysis & Reviews: Trading Signal for GOLD (XAU/USD) on August 15 - 16, 2022: sell if breaks 1,785 (21 SMA - uptrend)
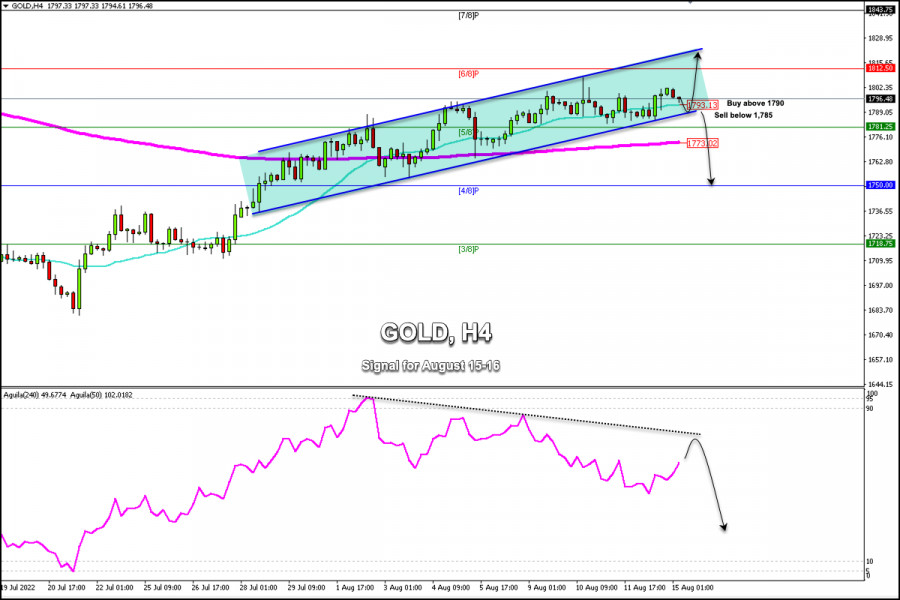
Early in the European session, gold (XAU/USD) was trading above the 21 SMA located at 1,793 and above the 200 EMA located at 1,763. We can see that gold is trading within an uptrend channel formed on July 26.
Last week, XAU/USD consolidated in the range of 1,781-1,807. On the other hand, lower US inflation data pushed US bond yields lower. Despite this gold failed to break the resistance zone of 1,812. (6/8 Murray).
If XAU/USD breaks above 6/8 Murray at 1,812, traders could expect gold to hit the resistance zone at 1,843 (7/8). Otherwise, if the price of gold continues below the psychological level of $1,800, the price may move to the 200 EMA at 1,773 and even fall to 4/8 Murray and 1,750.
Recent comments from several Fed officials indicate that the US central bank will continue to tighten its monetary policy. An interest rate hike of 50 basis points is expected in September. This data could limit the rise of gold and could exert downward pressure on the price to push towards support levels of 1,718.
Since the August 1, gold has been giving a negative divergence signal. If XAU/USD fails to break the strong resistance of 6/8 Murray located at 1812, a correction towards 4/8 Murray at 1,750 is likley to occur.
Our trading plan for the next few hours is to buy if there is a technical bounce around the uptrend channel or above the 21 SMA located at 1,793, targeting 1,800 and 1,812.
Conversely, a sharp break below the trend channel formed on the 4-hour chart and a close below 1,785 could be a clear signal to sell with targets at 1,773 and 1,750.
*The market analysis posted here is meant to increase your awareness, but not to give instructions to make a trade.
Analysis are provided by InstaForex.
Read More
-
16-08-2022, 03:51 AM #3618Senior Investor
- Join Date
- Dec 2019
- Posts
- 2,108
- Feedback Score
- 0
- Thanks
- 0
- Thanked 0 Times in 0 Posts
Existing analytical skills must be able to be considered properly, this is done so that traders can be more leverage in getting maximum trading security and comfort like what I got from Tickmill.
-
16-08-2022, 06:35 AM #3619Senior Investor
- Join Date
- Jun 2012
- Posts
- 3,492
- Feedback Score
- 0
- Thanks
- 0
- Thanked 9 Times in 9 Posts
Forex Analysis & Reviews: Forecast for GBP/USD on August 16, 2022
As a result of Monday, the British pound fell by 79 points, passing under the indicator balance line, which empirically shifts the players' interest mainly in short positions.
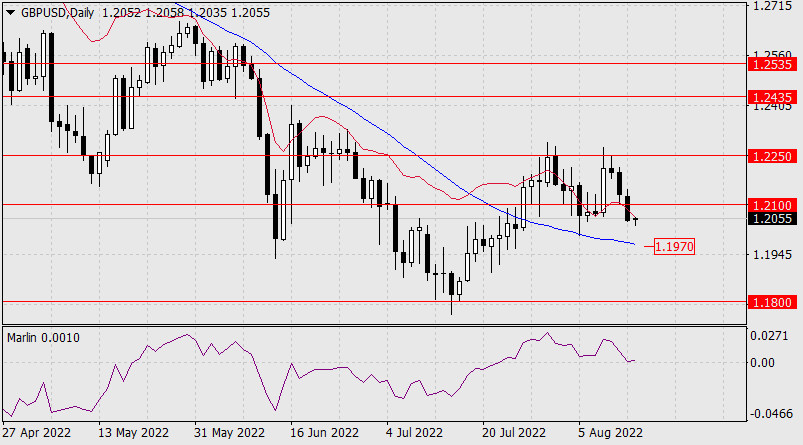
The price is systematically approaching the nearest support at 1.1970 - the MACD line of the daily scale. The Marlin Oscillator has crossed the border with the territory of the downward trend, the downward movement continues. The second target is the level of 1.1800.
The price settled below the balance indicator line on the four-hour chart, Marlin is falling in negative territory. We are waiting for a further slow decline in the pound.
*The market analysis posted here is meant to increase your awareness, but not to give instructions to make a trade.
Analysis are provided by InstaForex.
Read More
-
17-08-2022, 07:12 AM #3620Senior Investor
- Join Date
- Jun 2012
- Posts
- 3,492
- Feedback Score
- 0
- Thanks
- 0
- Thanked 9 Times in 9 Posts
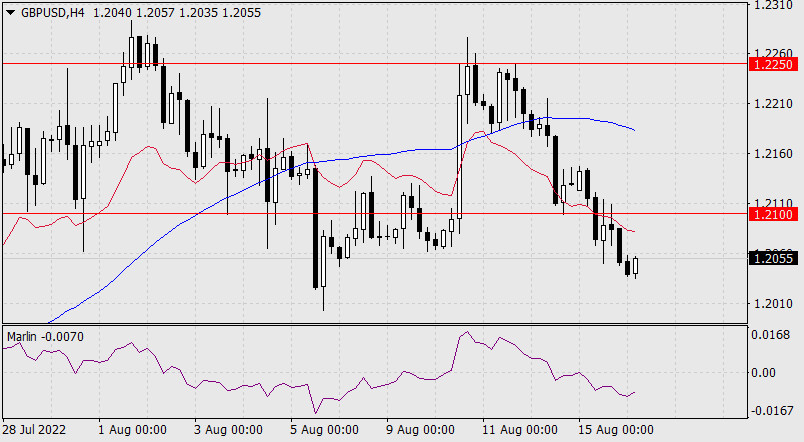
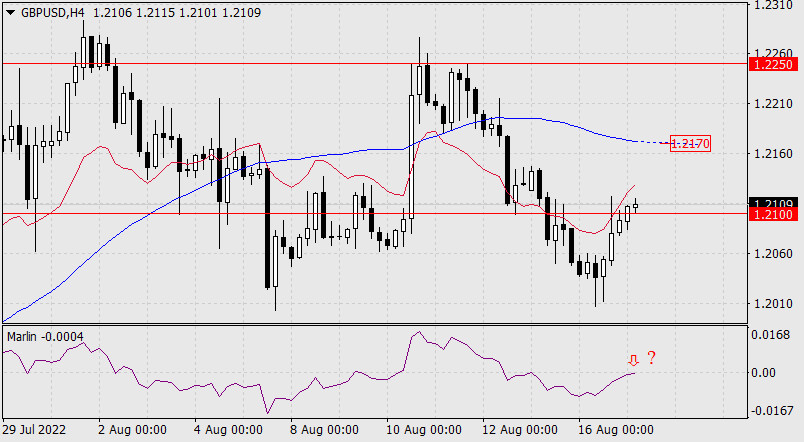
Forex Analysis & Reviews: Forecast for GBP/USD on August 17, 2022
The pound slowed down corrective growth at the target level of 1.2100. If the price does not settle above it, then we are waiting for a reversal with the development of support for the MACD line of the daily scale in the area of 1.1965. Further, the 1.1800 target may open.
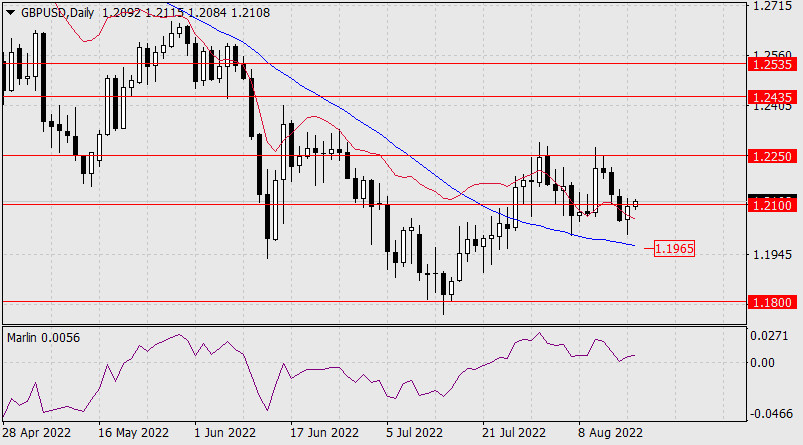
A large layer of inflation indicators for July will be released in the UK today. The core CPI is expected to rise from 5.8% y/y to 5.9% y/y, while the overall CPI could rise from 9.4% y/y to 9.8% y/y. Only a slight weakening is expected in producer prices - their selling prices may show an increase of 16.2% y/y against 16.5% y/y a month earlier. Thus, the option with the pound's growth is possible, we will consider its details on the four-hour chart.
Growth is limited by the MACD indicator line on the H4 chart, approximately at the level of 1.2170. At the current moment, the signal line of the Marlin Oscillator is turning down from the border with the territory of the growing trend. Therefore, consolidating under 1.2100 will resume the price decline in its main direction. First target at 1.1965.
Analysis are provided by InstaForex.
Read More
-
Sponsored Links


 Reply With Quote
Thread Information
Users Browsing this Thread
There are currently 1 users browsing this thread. (0 members and 1 guests)
 Posting Permissions
24 Hour Gold

Advertising
- Over 20.000 UNIQUE Daily!
- Get Maximum Exposure For Your Site!
- Get QUALITY Converting Traffic!
- Advertise Here Today!
Out Of Billions Of Website's Online.
Members Are Online From.
- Get Maximum Exposure For Your Site!
- Get QUALITY Converting Traffic!
- Advertise Here Today!
Out Of Billions Of Website's Online.
Members Are Online From.


