
 LinkBack URL
 About LinkBacks
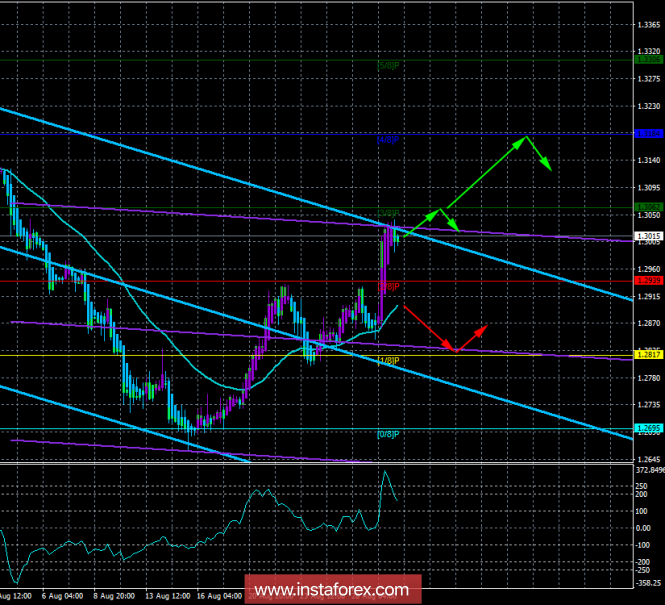
GBP/USD. Trading system "Regression channels". The growth of the pound sterling may be temporary
4-hour timeframe
Technical data:
Higher channel of linear regression: direction - down.
The lower channel of linear regression: direction - down.
The moving average (20; flattened) is up.
CCI: 159.4805
Yesterday, the GBP/USD currency pair showed impressive growth, after Michel Barnier, the main negotiator for Brexit from the EU, announced the forthcoming special offer for London. But according to the European Union, he did not mentioned the proposal's essence and how it will be resolved all disagreements with Britain. However, the markets reacted with strong purchases of the British pound. We believe that this market reaction is short-term and impulsive. So far, even the essence of the proposal is unclear. It is likely that Theresa May will not agree with this proposal, but almost nobody doubts that the negotiations will drag on beyond October. Thus, the pound sterling will remain under market pressure, and even Trump's desire to weaken the dollar may not prevent further strengthening of the pound/dollar, while with other currencies paired with the dollar may decline. The data on personal income adjustments and expenditure of the population in the United States will be publish today. Possibly, this data can affect the traders' mood but the most important agenda for today is about global topics, so these reports are unlikely have a significant effect to the trading course. From a technical point of view, a correction is brewing, as there was a very strong growth yesterday, and the last bar is painted in blue today.
Nearest support levels:
S1 = 1.2939
S2 = 1.2817
S3 - 1.2695
Nearest resistance levels:
R1 = 1.3062
R2 = 1.3184
R3 = 1.3306
Trading recommendations:
The GBP/USD pair may start to adjust. Correction can be worked out (if a second blue bar is formed in a row), since the descending sentiment of the pair remains. The target for short positions is the moving average line in small lots.
Buy-positions are recommended to resume in case of a reversal of the Heiken Ashi indicator above or overcoming the 1.3062 level. The next target for the bulls will be the Murray level of 1.3184.
In addition to the technical picture, one should also take into account the fundamental data and the time of their release.
Explanations for illustrations:
The upper channel of linear regression is the blue lines of unidirectional motion.
The junior channel is linear-violet lines of unidirectional motion.
CCI - the blue line in the regression window of the indicator.
Moving average (20; smoothed) - the blue line on the price chart.
Murray Levels - multi-colored horizontal stripes.
Heiken Ashi is an indicator that color bars in blue or purple.
* The presented market analysis is informative and does not constitute a guide to the transaction.
Analysis are provided byInstaForex.
Please visit our sponsors
Results 2,611 to 2,620 of 4086
Thread: InstaForex Wave Analysis
-
31-08-2018, 06:24 AM #2611Senior Investor


- Join Date
- Aug 2012
- Posts
- 1,942
- Feedback Score
- 0
- Thanks
- 0
- Thanked 0 Times in 0 Posts

-
03-09-2018, 06:45 AM #2612Senior Investor
- Join Date
- Aug 2012
- Posts
- 1,942
- Feedback Score
- 0
- Thanks
- 0
- Thanked 0 Times in 0 Posts
Elliott wave analysis of EUR/JPY for September 3, 2018
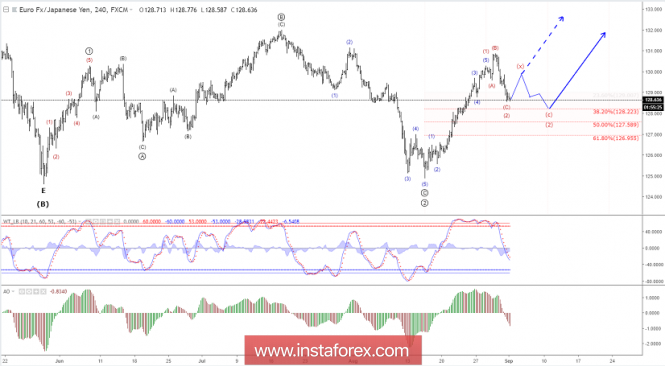
EUR/JPY has declined nicely and is now hovering just below our 128.78 - 129.00 target zone. We are looking for a recovery towards 129.85 next and from there it will be decided, whether more corrective downside pressure is needed or not.
In the short-term, a break above resistance at 129.14 will confirm the expected rally towards 129.85 and maybe even a continuation towards 130.87 and beyond.
If support at 128.54 gives away first, then a minor dip to support at 128.30 should be expected before a recovery is seen, but the potential downside should be limited for now.
R3: 129.85
R2: 129.32
R1: 129.14
Pivot: 128.83
S1: 128.54
S2: 128.30
S3: 127.94
Trading recommendation:
We took profit on our short position at 129.10 for a nice little profit of 58 pips and at the same time bought EUR. We have placed our stop at 128.10.
Analysis are provided byInstaForex.
-
04-09-2018, 05:25 AM #2613Senior Investor
- Join Date
- Aug 2012
- Posts
- 1,942
- Feedback Score
- 0
- Thanks
- 0
- Thanked 0 Times in 0 Posts
Pound: we only dream of peace
Political risks throw the British pound into the heat, then in the cold. The statement of the chief negotiator from the EU Michel Barnier that Brussels is ready to offer London an unprecedented deal, allowed quotes of the GBP/USD to soar above the psychologically important mark of 1.3. Alas, a few hours later Barnier declared a categorical disagreement with Theresa May's plan. At the same time, former Brexit Secretary David Davis said that he would vote against the Prime Minister's program, which involves significantly worse conditions than there were.
Theresa May will have a daunting task - first to find a compromise within the country, and then to reach an agreement with the EU. The situation is aggravated by the Congress of the Conservative party in September. And if in June the prime minister managed to maintain her leadership, now she will have to undergo a new test. As a result of the aggravation of political risks, the volatility of the sterling may come out of the trading range and go up, which will negatively affect the positions of the bulls on the GBP/USD. Britain has the highest ratio of the negative current account to GDP in the G20 countries, its financing requires an inflow of investments, and it is difficult to lure non-residents to the local market in conditions of increased volatility of the pound.
The dynamics of the volatility of the pound
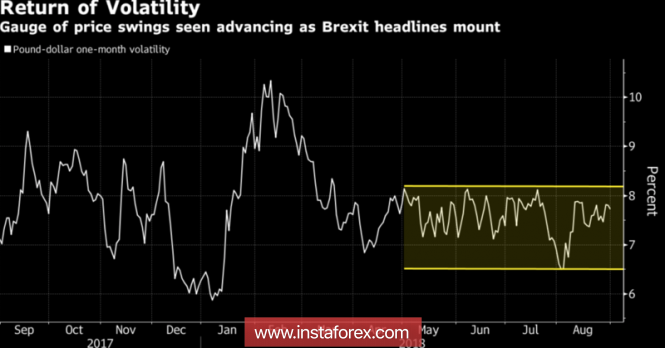
The pressure on sterling is exerted by disappointing macroeconomic statistics. The index of purchasing managers in the manufacturing sector in August was marked by the worst dynamics in the last two years. Export orders fell below the critical level of 50 for the first time since April 2016. As Bloomberg research shows, British companies preferred to save money instead of taking advantage of the devaluation and increase investment. Now, in the face of fears about the slowdown of the world economy, the decline in external demand creates serious problems for them.
It should be recognized that the fall of the GBP/USD contributed to the gradual recovery of the US dollar. Difficulties in negotiations between the United States and Canada lead investors to the idea that the settlement of the dispute between Washington and Beijing may take even longer, and the truce between the US and the EU will end very soon. As a result, the risks of escalation of trade conflicts have increased, which provides support to the US dollar.
The pound will have a rather difficult week, because after the release of data on business activity in the manufacturing sector, the indices of purchasing managers in the construction sector and in the service sector will be published. The last indicator is very important, as the non-production sector accounts for around 80% of British GDP. Add to this the continuing political risks, and it will become clear that the purchase of sterling should be treated very carefully. The aggravation of tensions between the EU and the UK and Theresa May's problems with retaining leadership in the Conservative party and with the vote in Parliament will become a catalyst for GBP/USD sales.
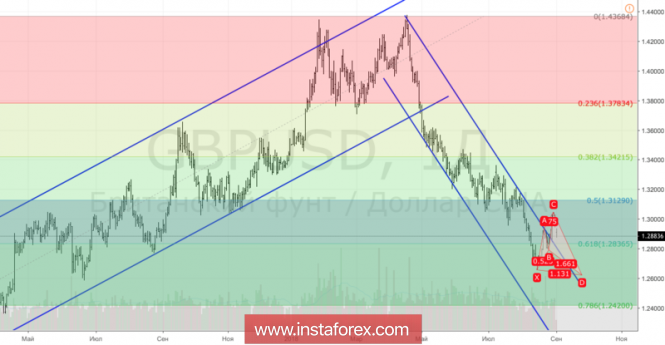
Technically, a breakthrough of support at 1,2835 and 1,2775 will increase the risks of implementing the target by 88.6% and 113% for the "Shark" pattern.
GBP/USD daily chart
Analysis are provided byInstaForex.
-
05-09-2018, 06:09 AM #2614Senior Investor
- Join Date
- Aug 2012
- Posts
- 1,942
- Feedback Score
- 0
- Thanks
- 0
- Thanked 0 Times in 0 Posts
Brent inspired by hurricanes
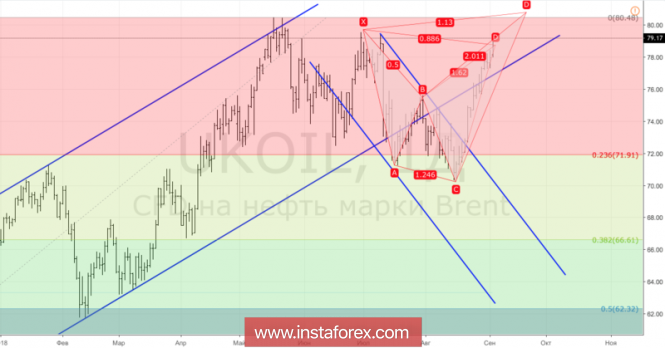
While investors are pondering whether OPEC and Russia will be able to compensate for the decline in Iranian exports, the approach of hurricane Gordon to the coast of the Gulf of Mexico allowed the "bulls" of Brent at arm's length to approach the psychologically important mark of $80 per barrel. The share of this territory accounts for about 17% of production and 45% of processing of all American oil, where it does not get agitated and start curtailing production? However, the impact of hurricanes on pricing in the oil market is often temporary. If a natural disaster is not as devastating as originally anticipated, buyers can begin to lock in profits.
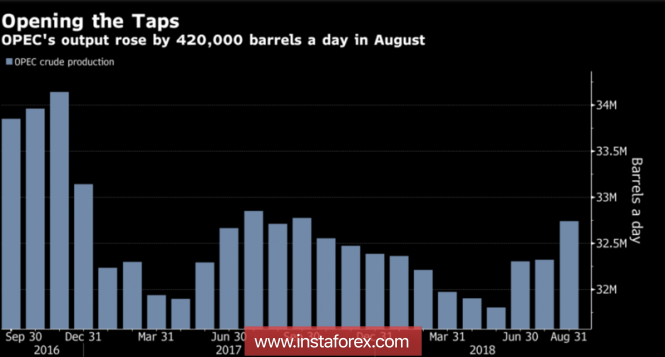
According to information gathered with the help of tankers, oil exports from Iran declined by 14% in August. Competent Wall Street Journal sources inside the country report a decrease from 2.3 million b/d in June to 1.5 million b/d in September. Deliveries of oil from the largest OPEC producer are falling by leaps and bounds, and in fact even before the entry into force of US sanctions in early November is still far. Exports to Europe fell by 45% in July, to South Korea-by 40%, India is considering a 50% reduction in purchases, although along with China and Turkey will continue to receive oil from Tehran. The hole should close the cartel, and Bloomberg experts expect production growth to 420 thousand b/d in August, to 32.74 million b/d. If the actual figure is smaller, "bulls" in Brent and WTI will continue their attacks.
Dynamics of oil production by OPEC
Despite the fact that Nigeria has tried to rein in speculators, saying that its efforts and the efforts of Saudi Arabia, the UAE and Angola are sufficient enough to compensate for the reduction of Iranian exports, the big banks are reviewing their forecasts upwards. Thus, Barclays believes that the North sea variety under the influence of US sanctions and the decline in production in several producing countries may exceed $80 per barrel in the short term. The average price forecast for 2020 was raised from $55 to $75 per barrel. BNP Paribas doubts that the decline in supplies from Iran, the occasional interruptions in Libya and the decline in production in Venezuela will be offset by an increase in OPEC production. The bank expects to see Brent averaging at $79 per barrel in 2019.
Favorable market conditions can easily be taken advantage of by American manufacturers. According to the US Energy Information Administration, the volume of production in the United States increased from May to June by 230 b/d and at any time could touch on the psychologically important level of 11 million b/d. Alas, the market still ignores this as a "bearish" driver for Brent and WTI, preferring to win back the factors of the hurricane and American sanctions against Iran.
Technically, on the daily chart, Brent achieved a target of 88.6% on the "Shark" pattern, which increases the probability of rollback in the direction of 23.6%, 38.2% and 50% of the CD wave. If the bulls manage to update the September peak and gain a foothold above it, the risks of continuing the upward campaign to the target will increase by 113%.
Brent, daily chart
Analysis are provided byInstaForex.
-
06-09-2018, 05:31 AM #2615Senior Investor
- Join Date
- Aug 2012
- Posts
- 1,942
- Feedback Score
- 0
- Thanks
- 0
- Thanked 0 Times in 0 Posts
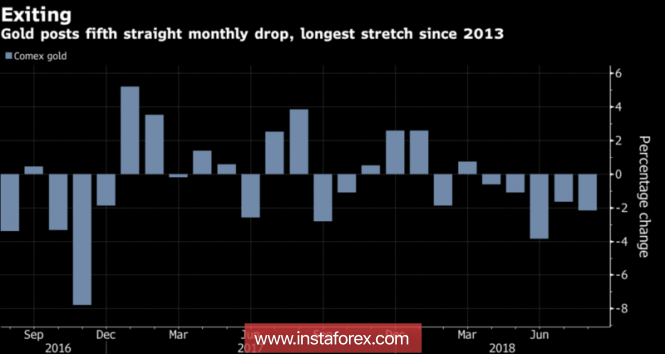
Gold wings have been clipped
August turned out to be the fifth consecutive month of gold closing in the red zone. The precious metal lost more than 2% amid the acceleration of the US economy, increasing the chances of four acts of monetary tightening of the Federal Reserve in 2018 and tensions over trade wars. And only moderately - "dovish" rhetoric of Jerome Powell in Jackson hole allowed the "bulls" to lick some of its wounds and try to break above $1210 per ounce. Alas, the joy of buyers was short-lived. In early September, the dollar began to recover in the face of problems in the negotiations between the United States and Canada and Donald Trump's intentions to expand the size of import duties against China by $200 billion.
The dynamics of gold
According to Citigroup Global Markets, investors do not need the gold in a world where stocks and bond yields are rising. The precious metal does not bring dividends and interest as equity and debt securities, and its status as a safe-haven asset has been taken away by the US dollar. As a result, speculators are increasing net short positions on the precious metal for the fifth week in a row and brought them to record highs. The stocks of the largest specialized fund SPDR Gold Shares fell to its lowest levels since November. From the levels of April highs, the index has lost 14%.
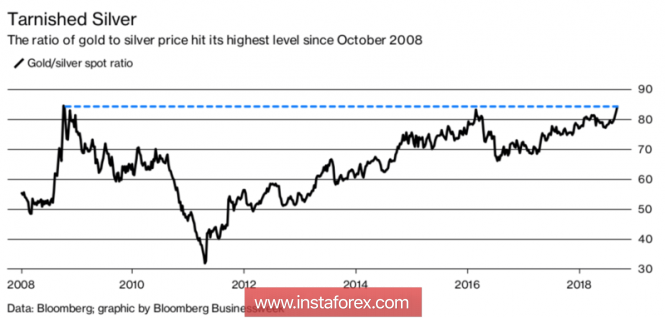
However, everything in this world is relative. Silver feels much worse than gold, the loss of which is about 16% since the beginning of the year. Due to the high proportion of industrial use in aggregate demand, this metal is more vulnerable to a slowdown in the global economy than the sector leader. As a result, their ratio has soared to the highest levels since the global financial crisis.
Dynamics of the ratio of gold and silver
Further dynamics of the XAU/USD will entirely depend on the US dollar, whose position looks strong. First, the Atlanta Federal Reserve predicts that US GDP in the third quarter will accelerate to 4.6%. Secondly, the futures market estimates the probability of four Federal funds rate increases in 2018 at 75%. A month ago, the figure was only slightly higher than 60%. Third, Trump is about to expand the size of import tariffs against China, which will increase the risks of a slowdown in the Chinese economy and put pressure on the markets of developing countries.
What can save gold from the sixth consecutive month of closing in the red zone? Correction in the US stock market, verbal intervention of Donald Trump, the deterioration of macroeconomic statistics in the United States and, finally, a breakthrough in the relationship between Washington and Beijing. So far, three of the four above events seem unlikely, and the rhetoric of the US president tends to put pressure on the dollar only in the short term. In this regard, sales of the XAU/USD on growth remain valid.
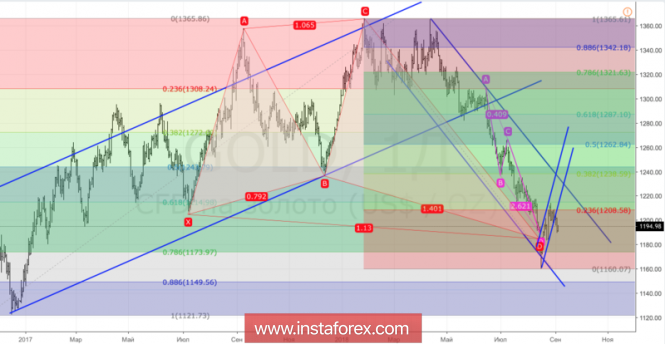
Technically, the inability of the bulls to hold gold prices above $1209 per ounce indicates their weakness. The initiative moved to the "bears", which broke through the lower border of the short-term upward trading channel and intend to restore the downward trend.
Gold, daily chart
Analysis are provided byInstaForex.
-
07-09-2018, 07:04 AM #2616Senior Investor
- Join Date
- Aug 2012
- Posts
- 1,942
- Feedback Score
- 0
- Thanks
- 0
- Thanked 0 Times in 0 Posts
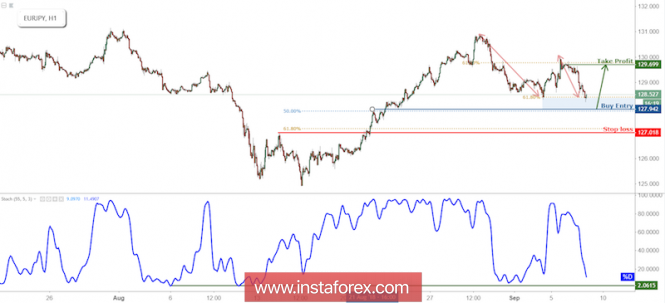
EUR/JPY Testing Support, Prepare For A Bounce
EUR/JPY is approaching its support at 127.94 (61.8% Fibonacci extension, 50% Fibonacci retracement, horizontal pullback support) where the price is expected to bounce up to its resistance at 129.69 (61.8% Fibonacci retracement, horizontal swing high resistance).
Stochastic (55, 5, 3) is approaching its support at 2% where a corresponding bounce is expected.
EUR/JPY is testing its support where we expect to see a bounce.
Buy above 127.94. Stop loss at 127.01. Take profit at 129.69.
Analysis are provided byInstaForex.
-
10-09-2018, 06:38 AM #2617Senior Investor
- Join Date
- Aug 2012
- Posts
- 1,942
- Feedback Score
- 0
- Thanks
- 0
- Thanked 0 Times in 0 Posts
Elliott wave analysis of EUR/NZD for September 10, 2018
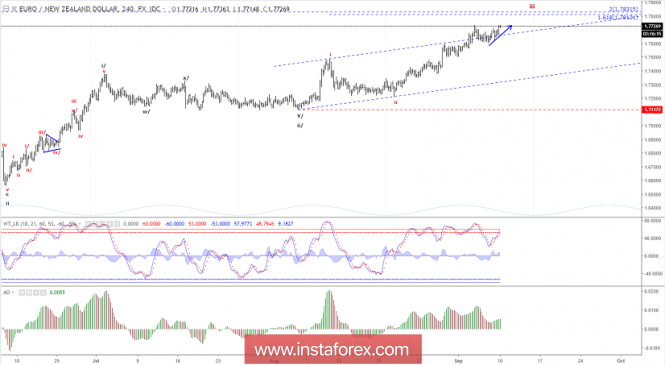
We continue to look for more upside pressure towards the next sub-target at 1.7820. Longer term resistance at 1.7820 only should prove to be a temporary cap as more upside towards strong resistance at 1.8369 remains expected.
Support is now seen at 1.7683 and again at 1.7638 only a break below the later, we confirm more sideways consolidation, and a dip to 1.7605 before the next strong push higher.
R3: 1.7820
R2: 1.7750
R1: 1.7734
Pivot: 1,7701
S1: 1.7683
S2: 1.7638
S3: 1.7605
Trading recommendation:
We are long EUR from 1.7330 with our stop placed at 1.7565, Upon a break above 1.7734 we will move our stop higher to 1.7595.
Analysis are provided byInstaForex.
-
11-09-2018, 06:10 AM #2618Senior Investor
- Join Date
- Aug 2012
- Posts
- 1,942
- Feedback Score
- 0
- Thanks
- 0
- Thanked 0 Times in 0 Posts
Elliott wave analysis of EUR/NZD for September 11, 2018
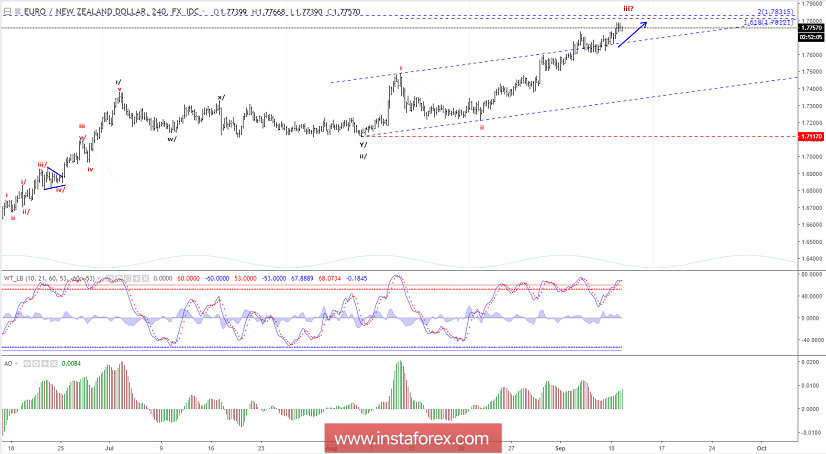
EUR/NZD keeps making headway towards the sub-target at 1.7820. Ideally, this resistance will only make a temporary top for the next swing higher towards the more important resistance at 1.8369.
Support is now seen at 1.7668 and if a break below here is seen, then a corrective decline closer to support at 1.7605 could be seen, but it should be short-lived as the steady uptrend continues higher towards 1.8369. R3: 1.8016
R2: 1.7919
R1: 1.7820
Pivot: 1.7738
S1: 1.7701
S2: 1.7668
S3: 1.7605
Trading recommendation:
We are long EUR from 1.7330 and we will move our stop higher to 1.7660.
Analysis are provided byInstaForex.
-
12-09-2018, 05:35 AM #2619Senior Investor
- Join Date
- Aug 2012
- Posts
- 1,942
- Feedback Score
- 0
- Thanks
- 0
- Thanked 0 Times in 0 Posts
Elliott wave analysis of EUR/NZD for September 12, 2018
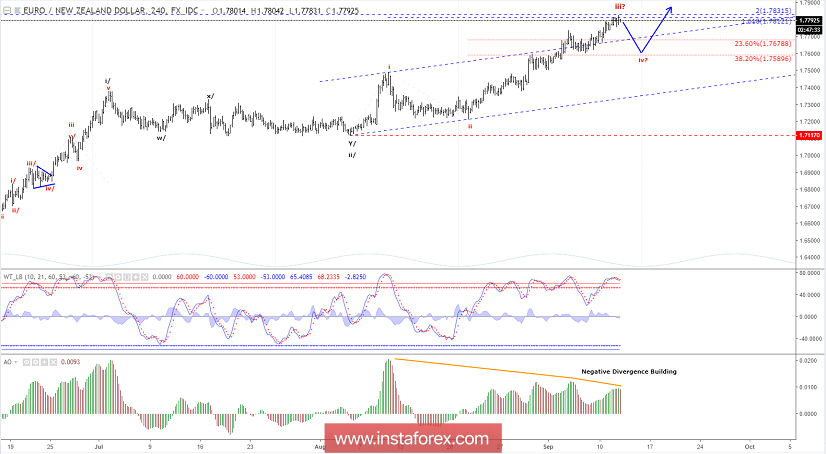
The 1.7820 targets have now been tested. The question is whether this was the top of red wave iii and a correction in red wave iv is needed now? We have seen a quite massive negative divergence being build in the run higher to 1.7820, so it should come as no surprise if a minor correction in red wave iv is about to begin. A break below 1.7738 will indicate this is the case.
That said, the rally to 1.7820 only represents the minimum extension target of red wave i. Therefore, we have to be equally ready for this extension to continue towards the next extension targets at 1.7954 (the 200% extension of red wave i) or even higher to the 261.8% extension target of red wave i at 1.8184.
R3: 1.7954
R2: 1.7900
R1: 1.7825 Pivot: 1.7738
S1: 1.7678
S2: 1.7629
S3: 1.7590
Trading recommendation:
We are long EUR from 1.7330 and we will move our stop higher to 1.7730.
Analysis are provided byInstaForex.
-
13-09-2018, 07:02 AM #2620Senior Investor
- Join Date
- Aug 2012
- Posts
- 1,942
- Feedback Score
- 0
- Thanks
- 0
- Thanked 0 Times in 0 Posts
Intraday technical levels and trading recommendations for GBP/USD for September 13, 2018

The recent bearish movement of the GBP/USD has shown signs of weakness since September 5 when an ascending bottom was established around 1.2800
The GBP/USD pair is currently testing the depicted downtrend line which comes to meet the pair around 1.3025-1.3090.
This price zone (1.3025-1.3090) corresponds to 50% and 61.8% Fibonacci levels where evident bearish rejection should be anticipated.
As long as sings of bearish rejection are demonstrated below 1.3020 (50% Fibo level), the short-term outlook remains bearish towards 1.2840 and 1.2780.
On the other hand, successful bullish breakout above 1.3090 will probably hinder the current bearish movement allowing further bullish advancement to occur towards 1.3200, 1.3250 and 1.3315.
Analysis are provided byInstaForex.
-
Sponsored Links


 Reply With Quote
Thread Information
Users Browsing this Thread
There are currently 1 users browsing this thread. (0 members and 1 guests)
 Posting Permissions
24 Hour Gold

Advertising
- Over 20.000 UNIQUE Daily!
- Get Maximum Exposure For Your Site!
- Get QUALITY Converting Traffic!
- Advertise Here Today!
Out Of Billions Of Website's Online.
Members Are Online From.
- Get Maximum Exposure For Your Site!
- Get QUALITY Converting Traffic!
- Advertise Here Today!
Out Of Billions Of Website's Online.
Members Are Online From.


