
 LinkBack URL
 About LinkBacks
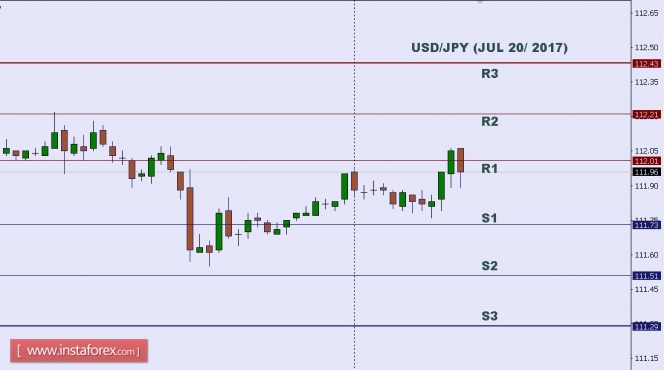
Technical analysis of USD/JPY for July 20, 2017
In Asia, Japan will release the BOJ Press Conference, All Industries Activity m/m, BOJ Policy Rate, BOJ Outlook Report, Monetary Policy Statement, and Trade Balance data, and the US will release some Economic Data, such as Natural Gas Storage, CB Leading Index m/m, Philly Fed Manufacturing Index, and Unemployment Claims. So, there is a probability the USD/JPY will move with low to medium volatility during this day.
TODAY'S TECHNICAL LEVEL:
Resistance. 3: 112.43.
Resistance. 2: 112.21.
Resistance. 1: 112.01.
Support. 1: 111.73.
Support. 2: 111.51.
Support. 3: 111.29.
Analysis are provided byInstaForex.
Please visit our sponsors
Results 2,351 to 2,360 of 4086
Thread: InstaForex Wave Analysis
-
20-07-2017, 06:08 AM #2351Senior Investor


- Join Date
- Aug 2012
- Posts
- 1,942
- Feedback Score
- 0
- Thanks
- 0
- Thanked 0 Times in 0 Posts

-
21-07-2017, 06:10 AM #2352Senior Investor
- Join Date
- Aug 2012
- Posts
- 1,942
- Feedback Score
- 0
- Thanks
- 0
- Thanked 0 Times in 0 Posts
Technical analysis of USD/CHF for July 21, 2017
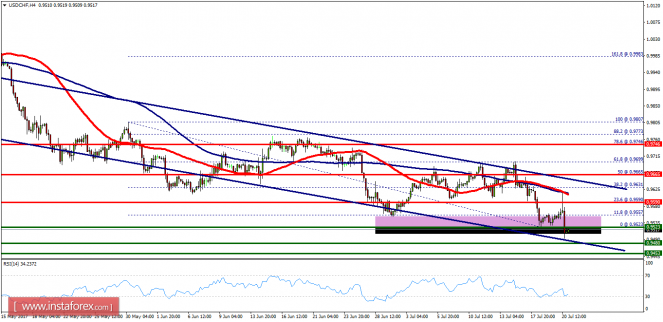
Overview:
The USD/CHF pair.
Pivot: 0.9590.
The swissy fell from the level of 0.9665 to bottom at 0.9523. The USD/CHF pair has faced strong support at the level of 0.9523 (the double bottom). Current price is around the spot of 0.9520. So, the strong support has been already faced at the level of 0.9523 and the pair is likely to try to approach it in order to test it again and form a double bottom. Hence, the USD/CHF pair is continuing to trade in a bullish trend from the new support level of 0.9523; to form a bullish channel. According to the previous events, we expect the pair to move between 0.9523 and 0.9665. Also, it should be noted major resistance is seen at 0.9665, while immediate resistance is found at 0.9590. Then, we may anticipate potential testing of 0.9665 to take place soon. Moreover, if the pair succeeds in passing through the level of 0.9665, the market will indicate a bullish opportunity above the level of 0.9665. A breakout of that target will move the pair further upwards to 0.9746. Buy orders are recommended above the area of 0.9523 with the first target at the level of 1.9590 and continue towards the levels of 0.9665 and 0.9746. However, if the USD/CHF pair fails to break out through the resistance level of 1.9590; the market will decline further to the level of 0.9453.
Analysis are provided byInstaForex.
-
24-07-2017, 07:41 AM #2353Senior Member

- Join Date
- Feb 2013
- Posts
- 212
- Feedback Score
- 0
- Thanks
- 0
- Thanked 0 Times in 0 Posts
NZD/USD Intraday technical levels and trading recommendations for July 24, 2017
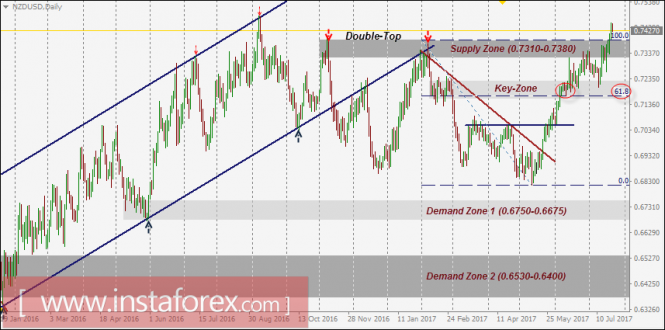
Daily Outlook
The NZD/USD pair has been trending up within the depicted bullish channel since January 2016.
In November 2016, early signs of bullish weakness were expressed on the chart when the pair failed to record a new high above 0.7400.
A bearish breakout of the lower limit of the channel took place in December 2016. In February 2017, the depicted short-term downtrend was initiated in the depicted supply zone (0.7310-0.7380).
However, a recent bullish breakout above the downtrend line took place in May 22. Since then, the market has been bullish as depicted on the chart.
The price zone of 0.7150-0.7230 (SUPPLY ZONE in confluence with 61.8% Fibonacci level) stood as a temporary resistance zone until a bullish breakout was expressed above 0.7230.
This resulted in a quick bullish advance towards the next supply zone around 0.7310-0.7380 which is being temporarily breached to the upside.
Now the price zone of 0.7310-0.7380 turns to be a newly-established demand-zone to be watched for possible bullish rejection if any bearish pullback occurs.
InstaForex analytical reviews will make you fully aware of market trends!
Being an InstaForex client, you are provided with a large number of free services for efficient trading.
-
25-07-2017, 07:40 AM #2354Senior Member
- Join Date
- Feb 2013
- Posts
- 212
- Feedback Score
- 0
- Thanks
- 0
- Thanked 0 Times in 0 Posts
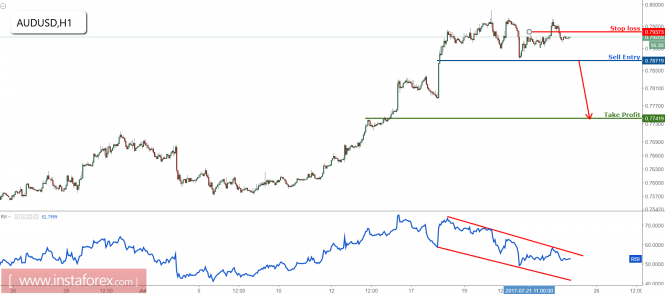
AUD/USD prepare to sell on break of key support
The price is hovering above key support at 0.7871 (Fibonacci retracement, horizontal swing low support) and we prepare to sell once price breaks this key level. Our profit target is a push down to next key support level at 0.7741 (Fibonacci retracement, horizontal pullback support).
RSI (55) is seeing bearish momentum within its bearish descending channel.
Sell below 0.7871. Stop loss is at 0.7937. Take profit is at 0.7741.
InstaForex analytical reviews will make you fully aware of market trends!
Being an InstaForex client, you are provided with a large number of free services for efficient trading.
-
26-07-2017, 07:54 AM #2355Senior Member
- Join Date
- Feb 2013
- Posts
- 212
- Feedback Score
- 0
- Thanks
- 0
- Thanked 0 Times in 0 Posts
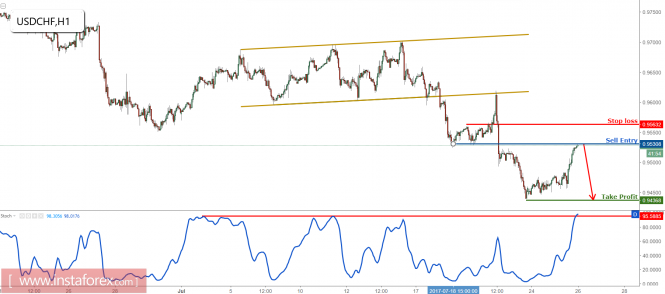
USD/CHF profit target reached perfectly, prepare to sell
The price has shot up perfectly and reached our profit target from yesterday. We prepare to sell below major resistance at 0.9530 (Fibonacci retracement, Fibonacci extension, horizontal pullback resistance) for a push down to at least 0.9436 support (Fibonacci extension, horizontal swing low support).
Stochastic (55,5,3) is right on major resistance at 95%.
Sell below 0.9530. Stop loss is at 0.9563. Take profit is at 0.9436.
InstaForex analytical reviews will make you fully aware of market trends!
Being an InstaForex client, you are provided with a large number of free services for efficient trading.
-
27-07-2017, 06:24 AM #2356Senior Investor
- Join Date
- Aug 2012
- Posts
- 1,942
- Feedback Score
- 0
- Thanks
- 0
- Thanked 0 Times in 0 Posts
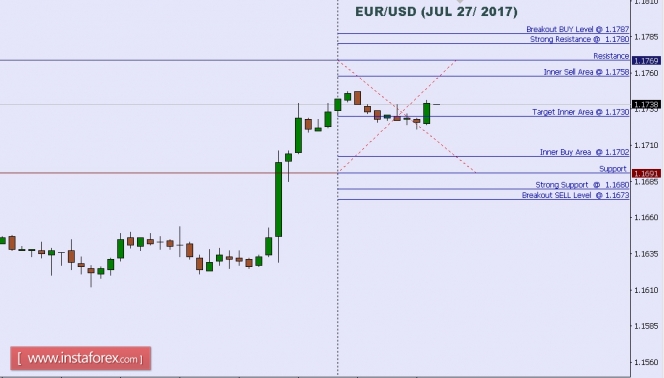
Technical analysis of EUR/USD for July 27, 2017
When the European market opens, some Economic Data will be released, such as Private Loans y/y, M3 Money Supply y/y, GfK German Consumer Climate, and Spanish Unemployment Rate. The US will release the Economic Data, too, such as Natural Gas Storage, Prelim Wholesale Inventories m/m, Goods Trade Balance, Durable Goods Orders m/m, Unemployment Claims, and Core Durable Goods Orders m/m, so, amid the reports, EUR/USD will move in a low to medium volatility during this day.
TODAY'S TECHNICAL LEVEL:
Breakout BUY Level: 1.1787.
Strong Resistance:1.1780.
Original Resistance: 1.1769.
Inner Sell Area: 1.1758.
Target Inner Area: 1.1730.
Inner Buy Area: 1.1702.
Original Support: 1.1691.
Strong Support: 1.1680. Breakout SELL Level: 1.1673.
Analysis are provided byInstaForex.
-
28-07-2017, 05:32 AM #2357Senior Investor
- Join Date
- Aug 2012
- Posts
- 1,942
- Feedback Score
- 0
- Thanks
- 0
- Thanked 0 Times in 0 Posts
Technical analysis of USD/CHF for July 28, 2017
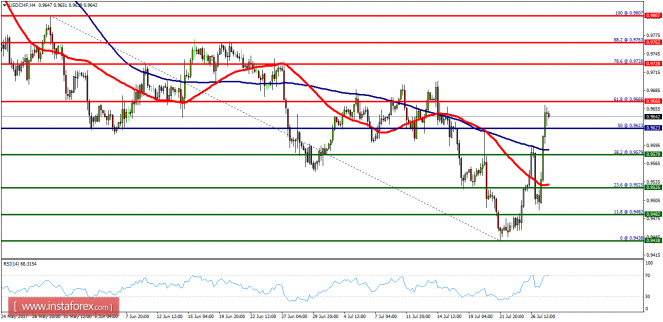
Overview:
The USD/CHF pair broke resistance which turned to a strong support at the level of 0.9579 yesterday. The level of 0.9579 coincides with 38.2% of Fibonacci, which is expected to act as a major support today. Since the trend is above the 38.2% Fibonacci level, the market is still in an uptrend. From this point, the USD/CHF pair is continuing in a bullish trend from the new support of 0.9575. Currently, the price is in a bullish channel. According to the previous events, we expect the USD/CHF pair to move between 0.9579 and 0.9728. In the H4 chart, resistance is seen at the levels of 0.9666 and 0.9728. Also, it should be noticed that the level of 0.9666 represents the daily pivot point. Therefore, a strong support will be formed at the level of 0.9575 providing a clear signal to buy with the targets seen at 0.9666. If the trend breaks the support at 0.9666 (the first resistance), the pair will move upwards continuing the development of the bullish trend to the level 0.9728 in order to test the daily resistance 2. However, the stop loss is to be placed below the level of 0.952.
Analysis are provided byInstaForex.
-
31-07-2017, 06:04 AM #2358Senior Investor
- Join Date
- Aug 2012
- Posts
- 1,942
- Feedback Score
- 0
- Thanks
- 0
- Thanked 0 Times in 0 Posts
Technical analysis of EUR/USD for July 31, 2017
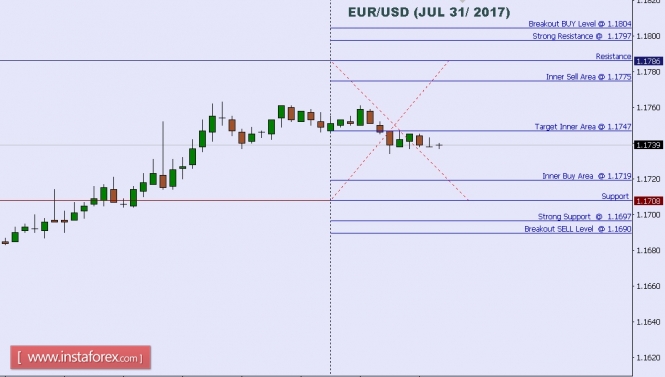
When the European market opens, some economic data will be released such as unemployment rate, Italian flash CPI m/m, core CPI flash estimate y/y, CPI flash estimate y/y, Italian monthly unemployment rate, and German retail sales m/m. The US will release its pending home sales m/m and Chicago PMI. So amid the reports, the EUR/USD will move in a low to medium volatility today.
Today's technical levels:
Breakout buy Level: 1.1804.
Strong resistance:1.1797.
Original resistance: 1.1786.
Inner sell area: 1.1775.
Target inner area: 1.1747.
Inner buy area: 1.1719.
Original support: 1.1708.
Strong support: 1.1697.
Breakout sell level: 1.1690.
Analysis are provided byInstaForex.
-
01-08-2017, 06:32 AM #2359Senior Investor
- Join Date
- Aug 2012
- Posts
- 1,942
- Feedback Score
- 0
- Thanks
- 0
- Thanked 0 Times in 0 Posts
EUR/JPY profit target reached once again, prepare to sell
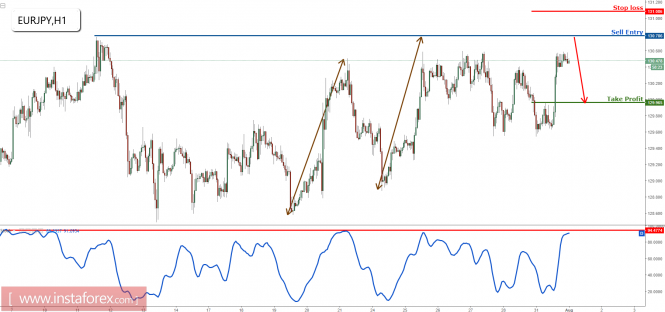
The price has bounced above our buying entry and is fast approaching our profit target once again. We prepare to sell below major resistance at 130.78 (Fibonacci extension, horizontal swing high resistance) for a drop towards 129.96 support (Fibonacci retracement, horizontal pullback support).
Stochastic (34,5,3) is seeing major resistance below 94% where we expect a strong drop from.
Correlation analysis: We are seeing JPY strength with AUD/JPY and EUR/JPY expecting drops. We are also expecting EUR weakness with strong resistance seen on EUR/USD and EUR/JPY.
Sell below 130.78. Stop loss is at 131.08. Take profit is at 129.96.
Analysis are provided byInstaForex.
-
02-08-2017, 06:10 AM #2360Senior Investor
- Join Date
- Aug 2012
- Posts
- 1,942
- Feedback Score
- 0
- Thanks
- 0
- Thanked 0 Times in 0 Posts
Technical analysis of USD/JPY for Aug 02, 2017
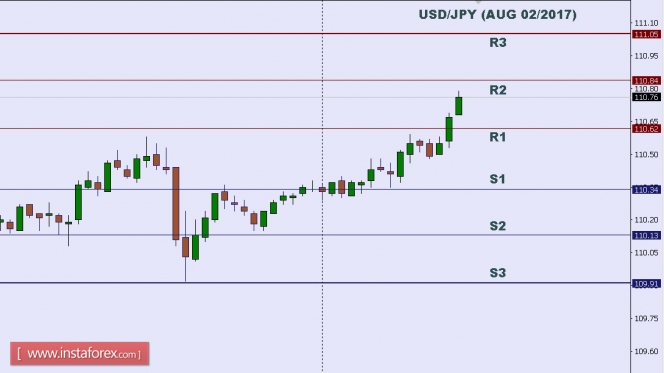
In Asia, Japan will release the Consumer Confidence and Monetary Base y/y data, and the US will release some Economic Data, such as Crude Oil Inventories and ADP Non-Farm Employment Change. So, there is a probability the USD/JPY will move with medium volatility during this day.
TODAY'S TECHNICAL LEVEL:
Resistance. 3: 111.05.
Resistance. 2: 110.84.
Resistance. 1: 110.62.
Support. 1: 110.34.
Support. 2: 110.13.
Support. 3: 109.91.
Analysis are provided byInstaForex.
-
Sponsored Links


 Reply With Quote
Thread Information
Users Browsing this Thread
There are currently 1 users browsing this thread. (0 members and 1 guests)
 Posting Permissions
24 Hour Gold

Advertising
- Over 20.000 UNIQUE Daily!
- Get Maximum Exposure For Your Site!
- Get QUALITY Converting Traffic!
- Advertise Here Today!
Out Of Billions Of Website's Online.
Members Are Online From.
- Get Maximum Exposure For Your Site!
- Get QUALITY Converting Traffic!
- Advertise Here Today!
Out Of Billions Of Website's Online.
Members Are Online From.


