
 LinkBack URL
 About LinkBacks
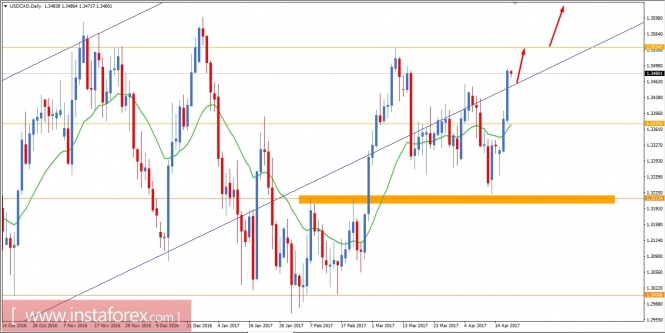
USD/CAD Fundamental Analysis April 20, 2017
USD/CAD is currently going through a good amount of volatility in the market. There had been bearish impulsive movement with a great pressure which was recently taken out by bullish impulsive moves. We have observed price exhaustions for several times in this pair and currently sentimental confusion going on in USD/CAD. Yesterday CAD Gov. Council Member Wilkins spoke about the key interest rates and monetary policy which did not provide any positive outcome for the currency, as a result USD gained a good amount of strength closing above 1.3450 yesterday. On the USD side, today market is expected to be quite volatile as important economic events like Philly Fed Manufacturing Index is going to be published which is expected to be at 25.6 which previously was at 32.8 and along with it Unemployment Claims report is going to be published which is expected to show an increase to 241K which previously was at 234K. If USD news comes positive today, we might see the pair climbing up much higher in the coming days.
Now let us look at the technical view, the price has again managed to enter the channel area with a daily close above 1.3450. As of the bullish impulsive pressure and taking out the prior swing on the upside, it is expected that the price will move towards 1.3535-50 resistance area and if the resistance area is taken out with a daily close then we will be looking forward to further upside movement towards 1.40.
Analysis are provided byInstaForex.
Please visit our sponsors
Results 2,291 to 2,300 of 4086
Thread: InstaForex Wave Analysis
-
20-04-2017, 07:06 AM #2291Senior Investor


- Join Date
- Aug 2012
- Posts
- 1,942
- Feedback Score
- 0
- Thanks
- 0
- Thanked 0 Times in 0 Posts

-
21-04-2017, 07:00 AM #2292Senior Investor
- Join Date
- Aug 2012
- Posts
- 1,942
- Feedback Score
- 0
- Thanks
- 0
- Thanked 0 Times in 0 Posts
Technical analysis of EUR/USD for Apr 21, 2017
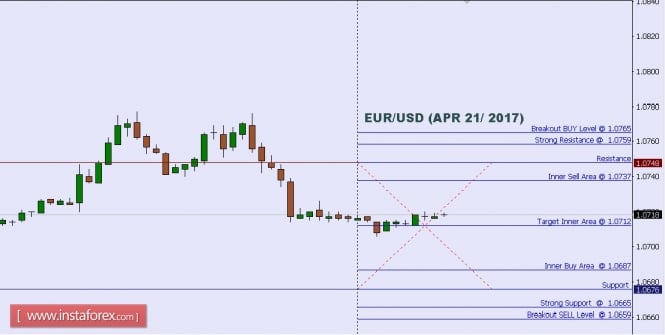
When the European market opens, some Economic Data will be released, such as Current Account, Flash Services PMI, Flash Manufacturing PMI, German Flash Services PMI, German Flash Manufacturing PMI, French Flash Services PMI, and French Flash Manufacturing PMI. The US will release the Economic Data, too, such as Existing Home Sales, Flash Services PMI, and Flash Manufacturing PMI, so, amid the reports, EUR/USD will move in a low to medium volatility during this day.
TODAY'S TECHNICAL LEVEL:
Breakout BUY Level: 1.0765.
Strong Resistance:1.0759.
Original Resistance: 1.0748.
Inner Sell Area: 1.0737.
Target Inner Area: 1.0712.
Inner Buy Area: 1.0687.
Original Support: 1.0676.
Strong Support: 1.0665.
Breakout SELL Level: 1.0659.
Analysis are provided byInstaForex.
-
24-04-2017, 06:32 AM #2293Senior Investor
- Join Date
- Aug 2012
- Posts
- 1,942
- Feedback Score
- 0
- Thanks
- 0
- Thanked 0 Times in 0 Posts
NZD/USD Intraday technical levels and trading recommendations for April 24, 2017
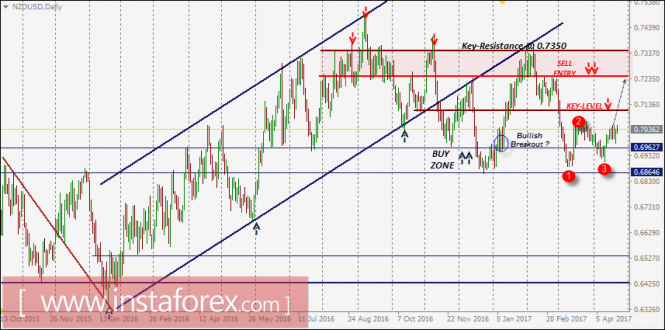
The NZD/USD pair was trapped within the depicted price range (0.6860-0.6990) until a bullish breakout occurred.
A bullish breakout above 0.6960-0.7000 allowed the pair to head toward the price level of 0.7100 (the key level) which failed to provide sufficient bearish pressure on the pair.
Bullish persistence above 0.7100 allowed a further advance toward 0.7250-0.7350 (Sell-Zone) where the bearish price action was expected. Bearish persistence below 0.7250 allowed a further decline toward 0.7100 then 0.6960 which failed to provide enough support for the pair.
That is why a further fall was expected toward 0.6860 (the lower limit of the depicted BUY zone) where a bullish position was suggested in previous articles.
Recently, a bullish breakout was achieved above the depicted key level (0.6960).
That is why the recent bearish pullback toward 0.6960 offered significant bullish rejection and a valid BUY entry which is running in profits now.
Note the depicted bullish 1-2-3 pattern with projection target around 0.7250 provided that bullish fixation above 0.7080-0.7100 (neckline) is achieved on a daily basis.
On the other hand, the price level of 0.7100 remains a significant key level to prevent a further bullish advance toward 0.7250.
Analysis are provided byInstaForex.
-
25-04-2017, 07:32 AM #2294Senior Investor
- Join Date
- Aug 2012
- Posts
- 1,942
- Feedback Score
- 0
- Thanks
- 0
- Thanked 0 Times in 0 Posts
Technical analysis of EUR/USD for Apr 25, 2017
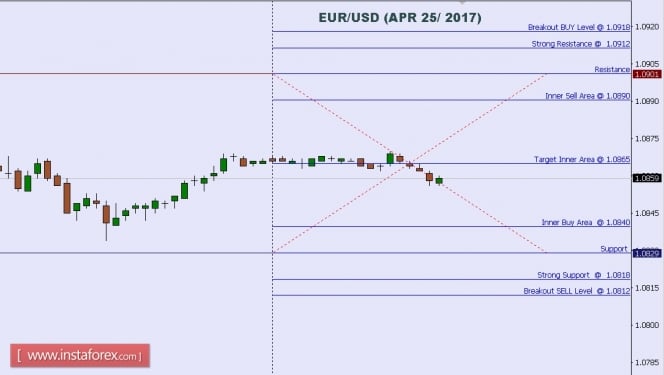
When the European market opens, some Economic Data will be released, such as Belgian NBB Business Climate. The US will release the Economic Data, too, such as Richmond Manufacturing Index, New Home Sales, CB Consumer Confidence, S&P/CS Composite-20 HPI y/y, and HPI m/m, so, amid the reports, EUR/USD will move in a low to medium volatility during this day.
TODAY'S TECHNICAL LEVEL:
Breakout BUY Level: 1.0918.
Strong Resistance:1.0912.
Original Resistance: 1.0901.
Inner Sell Area: 1.0890.
Target Inner Area: 1.0865.
Inner Buy Area: 1.0840.
Original Support: 1.0829.
Strong Support: 1.0818.
Breakout SELL Level: 1.0812.
Analysis are provided byInstaForex.
-
26-04-2017, 07:40 AM #2295Senior Investor
- Join Date
- Aug 2012
- Posts
- 1,942
- Feedback Score
- 0
- Thanks
- 0
- Thanked 0 Times in 0 Posts
Technical analysis of USD/JPY for April 26, 2017
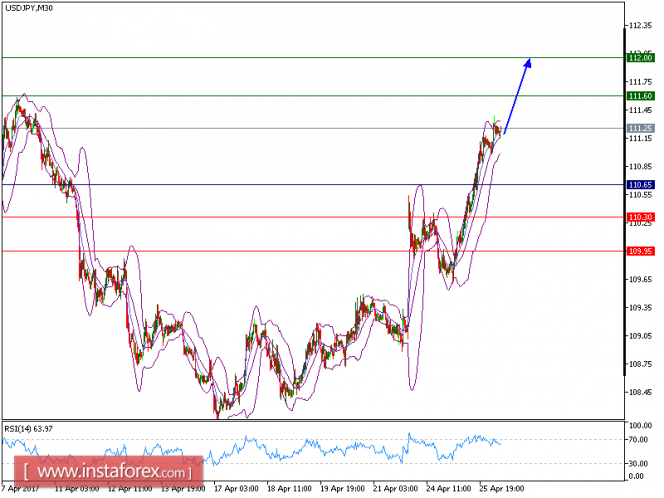
USD/JPY is expected to prevail its upside movement. The pair recorded a succession of higher tops and higher bottoms since April 25 and is holding on the upside. The rising 50-period moving average maintains the upside bias. The relative strength index is above its neutrality level at 50 and lacks downward momentum.
As long as 110.55 holds on the downside, look for a further advance toward 111.30 and even 111.60 in extension.
The pair is trading above its pivot point. It is likely to trade in a wider range as long as it remains above its pivot point. Therefore, long positions are recommended with the first target at 111.60 and the second one at 112.00. In the alternative scenario, short positions are recommended with the first target at 110.30 if the price moves below its pivot points. A break of this target may push the pair further downwards, and one may expect the second target at 109.95. The pivot point is at 110.65.
Resistance levels: 111.60, 112.00, and 112.45
Support levels: 110.30, 109.95, and 109.50
Analysis are provided byInstaForex.
-
27-04-2017, 07:23 AM #2296Senior Investor
- Join Date
- Aug 2012
- Posts
- 1,942
- Feedback Score
- 0
- Thanks
- 0
- Thanked 0 Times in 0 Posts
Technical analysis of EUR/USD for Apr 27, 2017
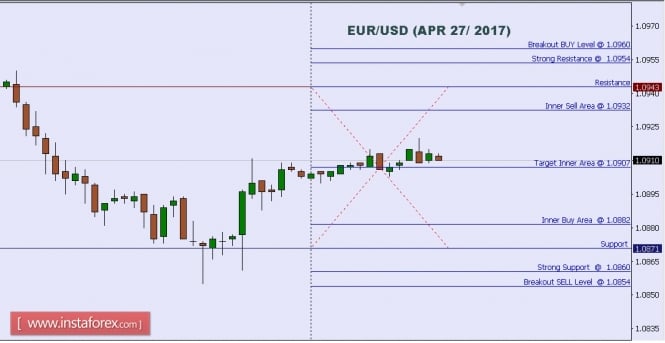
When the European market opens, some Economic Data will be released such as Minimum Bid Rate, Italian 10-y Bond Auction, Spanish Unemployment Rate, Spanish Flash CPI y/y, German Prelim CPI m/m, and GfK German Consumer Climate. The US will release the Economic Data, too, such as Natural Gas Storage, Pending Home Sales m/m, Prelim Wholesale Inventories m/m, Goods Trade Balance, Durable Goods Orders m/m, Unemployment Claims, and Core Durable Goods Orders m/m, so, amid the reports, EUR/USD will move in a low to medium volatility during this day.
TODAY'S TECHNICAL LEVEL:
Breakout BUY Level: 1.0960.
Strong Resistance:1.0954.
Original Resistance: 1.0943.
Inner Sell Area: 1.0932.
Target Inner Area: 1.0907.
Inner Buy Area: 1.0882.
Original Support: 1.0871.
Strong Support: 1.0860.
Breakout SELL Level: 1.0854.
Analysis are provided byInstaForex.
-
28-04-2017, 08:10 AM #2297Senior Member

- Join Date
- Feb 2013
- Posts
- 212
- Feedback Score
- 0
- Thanks
- 0
- Thanked 0 Times in 0 Posts
Daily analysis of USDX for April 28, 2017
The index is now capped by the resistance level of 99.28, as the bulls are trying to gather enough bullish momentum to perform a breakout to the upside. However, a pullback might happen to re-test the support area of 98.83. The 200 SMA on H1 chart remains an active dynamic supply zone to cap further gains. MACD indicator is turning neutral, supporting a sideways tone for USDX in the coming days.
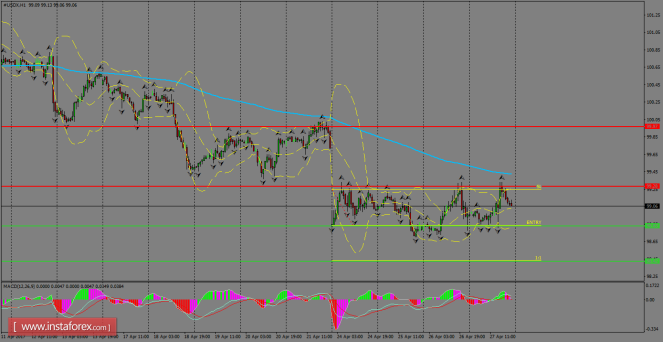
H1 chart's resistance levels: 99.28 / 99.97
H1 chart's support levels: 98.83 / 98.42
Trading recommendations for today:
Based on the H1 chart, place sell (short) orders only if the USD Index breaks with a bearish candlestick; the support level is at 98.83, take profit is at 98.42 and stop loss is at 99.24.
InstaForex analytical reviews will make you fully aware of market trends!
Being an InstaForex client, you are provided with a large number of free services for efficient trading.
More analysis - at instaforex.com
-
03-05-2017, 08:14 AM #2298Senior Investor
- Join Date
- Aug 2012
- Posts
- 1,942
- Feedback Score
- 0
- Thanks
- 0
- Thanked 0 Times in 0 Posts
Technical analysis of USD/JPY for May 03, 2017
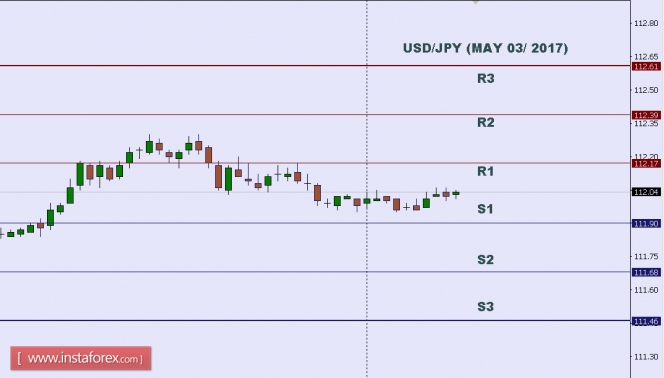
In Asia, today Japan will not release any economic data. However, the US will release a series of fundamental data such as Federal Funds Rate, FOMC Statement, Crude Oil Inventories, ISM Non-Manufacturing PMI, Final Services PMI, and ADP Non-Farm Employment Change. So there is a probability the USD/JPY pair will move with medium volatility during this day.
TODAY'S TECHNICAL LEVEL:
Resistance 3: 112.61.
Resistance 2: 112.39.
Resistance 1: 112.17.
Support 1: 111.90.
Support 2: 111.63.
Support 3: 111.46.
Analysis are provided byInstaForex.
-
04-05-2017, 07:34 AM #2299Senior Investor
- Join Date
- Aug 2012
- Posts
- 1,942
- Feedback Score
- 0
- Thanks
- 0
- Thanked 0 Times in 0 Posts
Technical analysis of USD/JPY for May 4, 2017
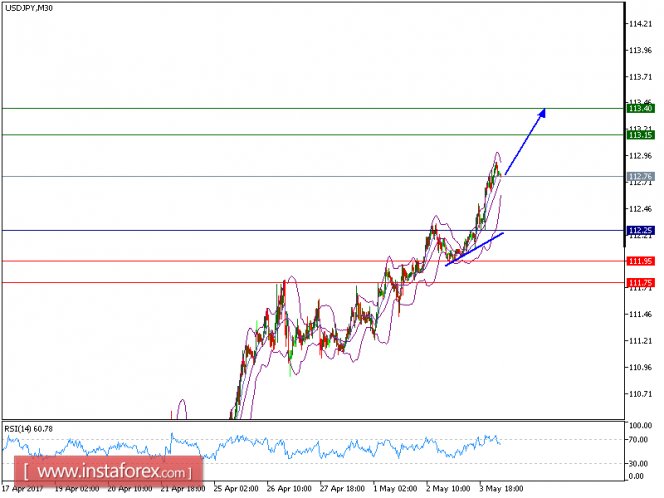
USD/JPY is expected to prevail its upside movement. The technical picture of the pair is positive above a rising trend line, which emerged on May 3, and is holding on the upside. The rising 20-period and 50-period moving averages are playing support roles and maintain the upside bias. The relative strength index is supported by a bullish trend line and is above its neutrality level at 50.
As long as 112.25 holds on the downside, look for a further advance toward 113.15 and even 113.40 in extension. The pair is trading above its pivot point. It is likely to trade in a wider range as long as it remains above its pivot point. Therefore, long positions are recommended with the first target at 113.15 and the second one at 113.40. In the alternative scenario, short positions are recommended with the first target at 111.95 if the price moves below its pivot points. A break of this target may push the pair further downwards, and one may expect the second target at 111.75. The pivot point lies at 112.25.
Resistance levels: 113.15, 113.40, and 113.85
Support levels: 111.95, 111.75, and 111.20
Analysis are provided byInstaForex.
-
05-05-2017, 08:20 AM #2300Senior Investor
- Join Date
- Aug 2012
- Posts
- 1,942
- Feedback Score
- 0
- Thanks
- 0
- Thanked 0 Times in 0 Posts
Daily analysis of GBP/USD for May 05, 2017
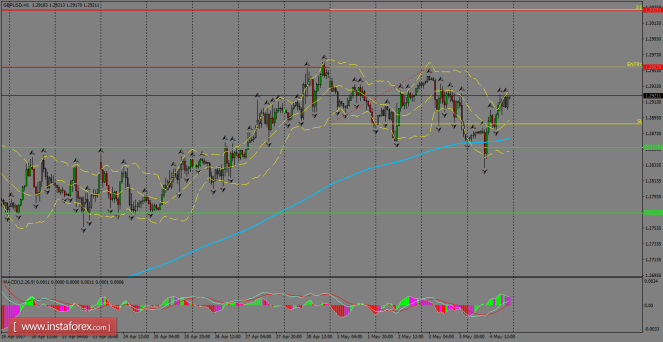
GBP/USD managed to rebound above the 200 SMA on H1 chart amid a broad-based weakness in the US Dollar. The pair is still trapped in a range established since April 28th. Now the pair aims to test the resistance zone of 1.2957 once again. If it manages to break above that area, we can expect further advances toward the 1.3029 level.
H1 chart's resistance levels: 1.2957 / 1.3029
H1 chart's support levels: 1.2855 / 1.2652
Trading recommendations for today: Based on the H1 chart, buy (long) orders only if the GBP/USD pair breaks a bullish candlestick; the resistance level is at 1.2957, take profit is at 1.3029 and stop loss is at 1.2887.
Analysis are provided byInstaForex.
-
Sponsored Links


 Reply With Quote
Thread Information
Users Browsing this Thread
There are currently 1 users browsing this thread. (0 members and 1 guests)
 Posting Permissions
24 Hour Gold

Advertising
- Over 20.000 UNIQUE Daily!
- Get Maximum Exposure For Your Site!
- Get QUALITY Converting Traffic!
- Advertise Here Today!
Out Of Billions Of Website's Online.
Members Are Online From.
- Get Maximum Exposure For Your Site!
- Get QUALITY Converting Traffic!
- Advertise Here Today!
Out Of Billions Of Website's Online.
Members Are Online From.


