
 LinkBack URL
 About LinkBacks
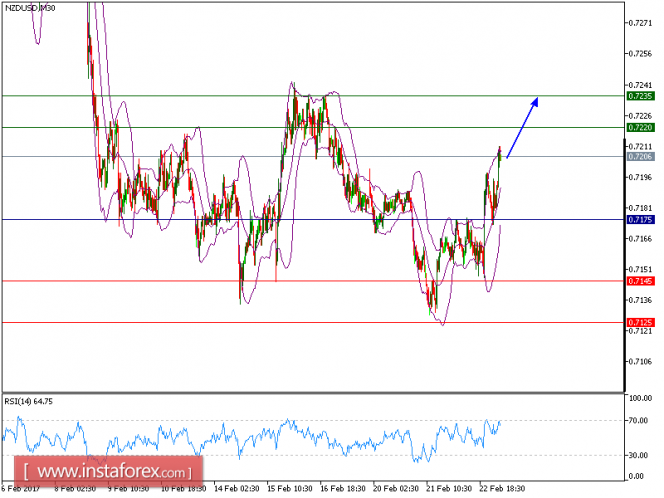
Technical analysis of NZD/USD for February 23, 2017
NZD/USD is expected to trade in a higher range. The pair is trading above its rising 20-period and 50-period moving averages, which play support roles and maintain the upside bias. The relative strength index is above its neutrality level at 50 and lacks downward momentum. Additionally, 0.7175 is playing a key support role, which should limit the downside potential. As long as this key level is not broken, look for a further upside toward 0.7220 and even 0.7235 in extension.
The pair is trading above its pivot point. It is likely to trade in a wider range as long as it remains above its pivot point. Therefore, long positions are recommended with the first target at 0.7220 and the second one at 0.7235. In the alternative scenario, short positions are recommended with the first target at 0.7145, if the price moves below its pivot points. A break of this target is likely to push the pair further downwards, and one may expect the second target at 0.7125. The pivot point is at 0.7175.
Resistance levels: 0.7220, 0.7235, and 0.7260
Support levels: 0.7145, 0.7125, and 0.7070
More analysis - at instaforex.com
Please visit our sponsors
Results 2,251 to 2,260 of 4086
Thread: InstaForex Wave Analysis
-
23-02-2017, 08:27 AM #2251Senior Investor


- Join Date
- Jun 2012
- Posts
- 3,492
- Feedback Score
- 0
- Thanks
- 0
- Thanked 9 Times in 9 Posts

-
24-02-2017, 11:07 AM #2252Senior Member

- Join Date
- Feb 2013
- Posts
- 212
- Feedback Score
- 0
- Thanks
- 0
- Thanked 0 Times in 0 Posts
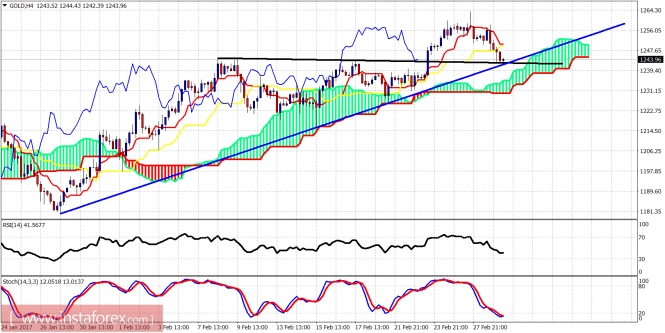
Technical analysis of Gold for February 24, 2017
The gold price has broken out of the ascending triangle pattern as we expected. The minimum target is at $1,300. The trend is bullish. We could see a pullback towards the $1,247-45 area, but I expect the trend to continue.
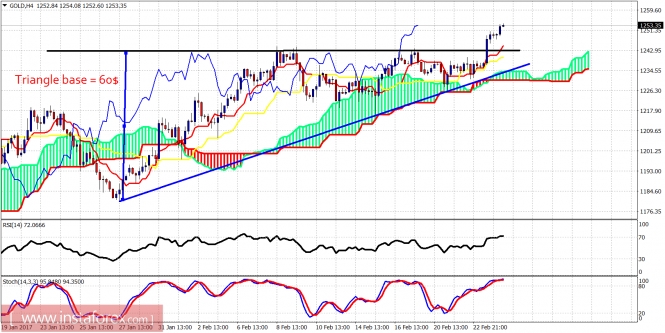
Black line - resistance (broken)
Blue line - support
The base of the ascending triangle is 60$ approximately. The break out above $1,245 should provide a similar size upward move. Therefore the target is $1,245 plus 60$ at $1,300. There are no divergence signs on the four-hour chart. I expect the uptrend to continue.
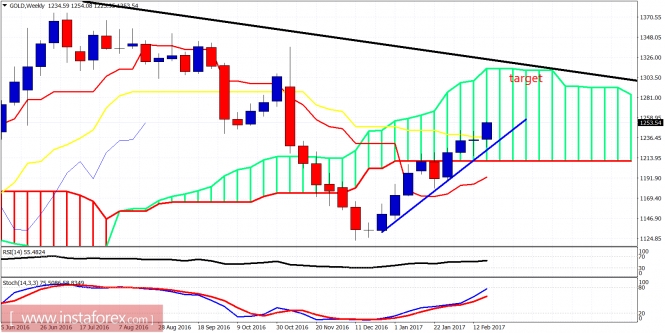
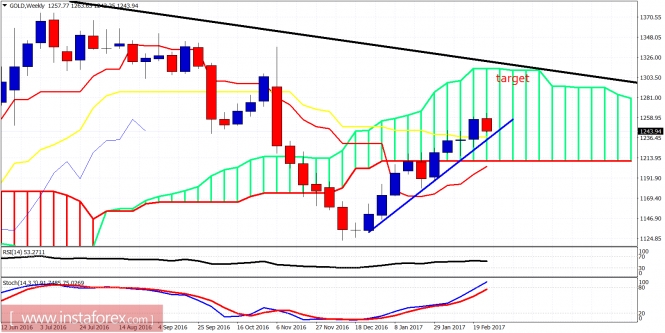
Blue line - trend line support
Black line -long-term resistance
The gold price is breaking above the weekly kijun-sen (yellow line indicator). This is a very bullish sign. The oscillators have room to the upside so I expect the long-term resistance trend line to be tested. So our target of $1,300 is very possible over the coming weeks.
InstaForex analytical reviews will make you fully aware of market trends!
Being an InstaForex client, you are provided with a large number of free services for efficient trading.
More analysis - at instaforex.com
-
27-02-2017, 07:30 AM #2253Senior Investor
- Join Date
- Jun 2012
- Posts
- 3,492
- Feedback Score
- 0
- Thanks
- 0
- Thanked 9 Times in 9 Posts
Technical analysis of EUR/USD for Feb 27, 2017
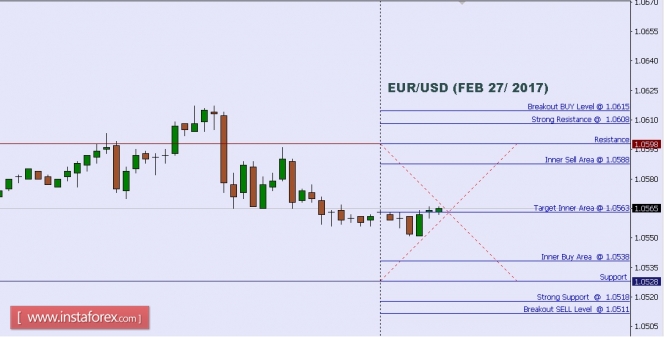
When the European market opens, some Economic Data will be released, such as Italian 10-y Bond Auction, Private Loans y/y, M3 Money Supply y/y and Spanish Flash CPI y/y. The US will release the economic data, too, such as Pending Home Sales m/m, Durable Goods Orders m/m and Core Durable Goods Orders m/m, so, amid the reports, EUR/USD will move in a low to medium volatility during this day.
TODAY'S TECHNICAL LEVEL:
Breakout BUY Level: 1.0615.
Strong Resistance:1.0608.
Original Resistance: 1.0598.
Inner Sell Area: 1.0588.
Target Inner Area: 1.0563.
Inner Buy Area: 1.0538.
Original Support: 1.0528.
Strong Support: 1.0518.
Breakout SELL Level: 1.0511.
More analysis - at instaforex.com
-
27-02-2017, 05:52 PM #2254Junior Member
- Join Date
- Feb 2017
- Posts
- 10
- Feedback Score
- 0
- Thanks
- 0
- Thanked 0 Times in 0 Posts
Hey there, I am really feeling great to having these wave analysis reports here. I think you should have too keep update your wave analysis here. Thanks!
-
28-02-2017, 07:32 AM #2255Senior Investor
- Join Date
- Jun 2012
- Posts
- 3,492
- Feedback Score
- 0
- Thanks
- 0
- Thanked 9 Times in 9 Posts
Technical analysis of EUR/USD for Feb 28, 2017
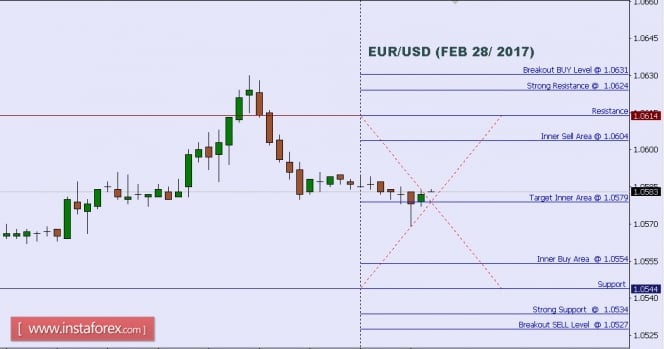
When the European market opens, some Economic Data will be released, such as Italian Prelim CPI m/m, French Prelim GDP q/q, French Prelim CPI m/m and French Consumer Spending m/m. The US will release the economic data, too, such as Richmond Manufacturing Index, CB Consumer Confidence, Chicago PMI, S&P/CS Composite-20 HPI y/y, Prelim Wholesale Inventories m/m, Prelim GDP Price Index q/q, Goods Trade Balance and Prelim GDP q/q, so, amid the reports, EUR/USD will move in a low to medium volatility during this day.
TODAY'S TECHNICAL LEVEL:
Breakout BUY Level: 1.0631.
Strong Resistance:1.0624.
Original Resistance: 1.0614.
Inner Sell Area: 1.0604.
Target Inner Area: 1.0579.
Inner Buy Area: 1.0554.
Original Support: 1.0544.
Strong Support: 1.0534.
Breakout SELL Level: 1.0527.
More analysis - at instaforex.com
-
01-03-2017, 09:35 AM #2256Senior Member
- Join Date
- Feb 2013
- Posts
- 212
- Feedback Score
- 0
- Thanks
- 0
- Thanked 0 Times in 0 Posts
Technical analysis of Gold for March 1, 2017
Gold pulled back yesterday, as we explained in our last post, towards the breakout area of $1,245 for a back test. This is a justified move and does not change our medium-term bullish plans. Our targets remain $1,280-$1,320. For the bullish scenario to play out, Gold needs to reverse from current levels.
Black line - resistance (broken)
Blue line - support
The price is trading above the Ichimoku cloud and above the blue trend line support. The price has reached the break out area of $1,245 and I expect to see an upward reversal from the current levels. Support below $1,245 is found at $1,231. Resistance is at $1,250 and the next is at $1,257.
Blue line - long-term support trend line
Black line - long-term resistance trend line
Despite the negative start in the week for Gold, I expect the week to end higher as I believe we may already have seen the weekly lows. I continue to expect Gold to reach $1,280-$1,320. I remain bullish.
InstaForex analytical reviews will make you fully aware of market trends!
Being an InstaForex client, you are provided with a large number of free services for efficient trading.
More analysis - at instaforex.com
-
02-03-2017, 08:13 AM #2257Senior Investor
- Join Date
- Jun 2012
- Posts
- 3,492
- Feedback Score
- 0
- Thanks
- 0
- Thanked 9 Times in 9 Posts
Technical analysis of GBP/JPY for March 02, 2017
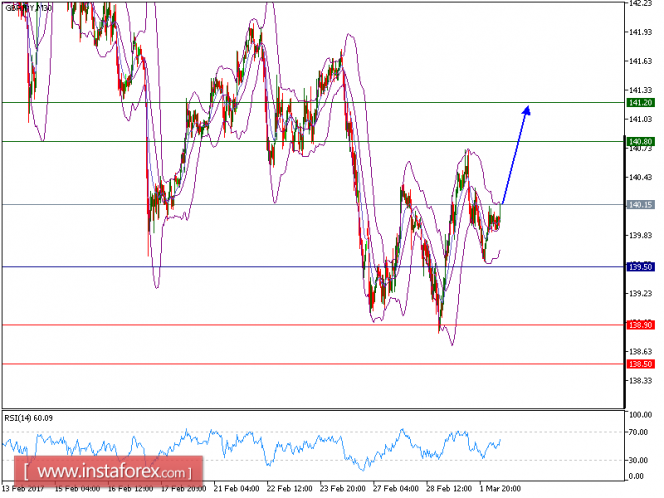
GBP/JPY is expected to trade in higher range. The pair resumed its up trend after the recent bullish breakout of its key level at 139.50. The previous resistance now plays a strong support role, which should limit any downward attempts. In addition, the 50-period moving average is heading upward, and should continue to push the prices higher.
In these perspectives, as long as 139.50 holds on the downside, further advance seems to be on the cards to 140.38 and 141.20 in extension.
The pair is trading above its pivot point. It is likely to trade in a wider range as long as it remains above its pivot point. Therefore, long positions are recommended with the first target at 140.80 and the second one at 141.20. In the alternative scenario, short positions are recommended with the first target at 138.90, if the price moves below its pivot points. A break of this target may push the pair further downwards, and one may expect the second target at 138.50. The pivot point is at 139.50.
Resistance levels: 140.80, 141.20, and 142.00
Support levels: 138.90,138.50, and 138.00
More analysis - at instaforex.com
-
03-03-2017, 07:27 AM #2258Senior Investor
- Join Date
- Jun 2012
- Posts
- 3,492
- Feedback Score
- 0
- Thanks
- 0
- Thanked 9 Times in 9 Posts
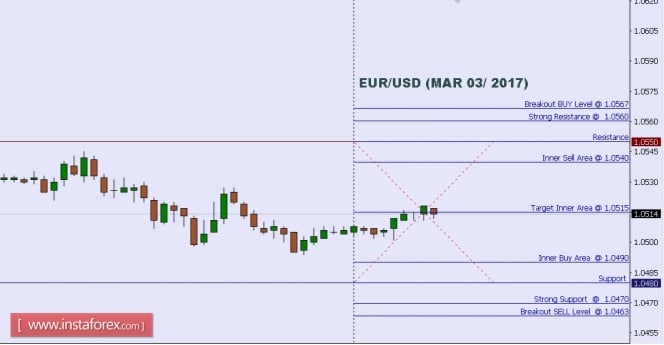
Technical analysis of EUR/USD for Mar 03, 2017
When the European market opens, some Economic Data will be released, such as Retail Sales m/m, Final Services PMI, German Final Services PMI, French Final Services PMI, Italian Services PMI, Spanish Services PMI and German Retail Sales m/m. The US will release the economic data, too, such as ISM Non-Manufacturing PMI and Final Services PMI, so, amid the reports, EUR/USD will move in a low to medium volatility during this day.
TODAY'S TECHNICAL LEVEL:
Breakout BUY Level: 1.0567.
Strong Resistance:1.0560.
Original Resistance: 1.0550.
Inner Sell Area: 1.0540.
Target Inner Area: 1.0515.
Inner Buy Area: 1.0490.
Original Support: 1.0480.
Strong Support: 1.0470.
Breakout SELL Level: 1.0463.
More analysis - at instaforex.com
-
06-03-2017, 07:39 AM #2259Senior Investor
- Join Date
- Jun 2012
- Posts
- 3,492
- Feedback Score
- 0
- Thanks
- 0
- Thanked 9 Times in 9 Posts
Technical analysis of EUR/USD for Mar 06, 2017
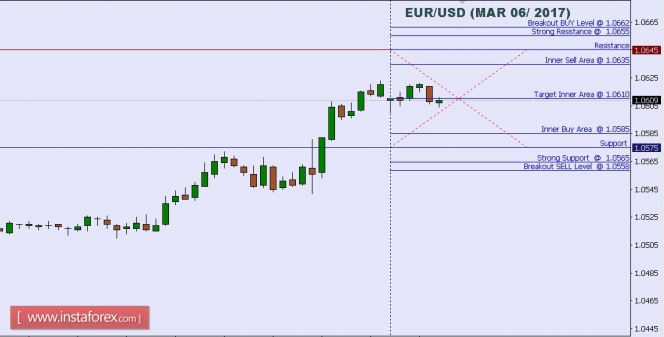
When the European market opens, some Economic Data will be released, such as Sentix Investor Confidence and Retail PMI. The US will release the economic data, too, such as Factory Orders m/m, so, amid the reports, EUR/USD will move in a low to medium volatility during this day.
TODAY'S TECHNICAL LEVEL:
Breakout BUY Level: 1.0662.
Strong Resistance:1.0655.
Original Resistance: 1.0645.
Inner Sell Area: 1.0635.
Target Inner Area: 1.0610.
Inner Buy Area: 1.0585.
Original Support: 1.0575.
Strong Support: 1.0565.
Breakout SELL Level: 1.0558.
More analysis - at instaforex.com
-
07-03-2017, 07:23 AM #2260Senior Investor
- Join Date
- Jun 2012
- Posts
- 3,492
- Feedback Score
- 0
- Thanks
- 0
- Thanked 9 Times in 9 Posts
Technical analysis of EUR/USD for Mar 07, 2017
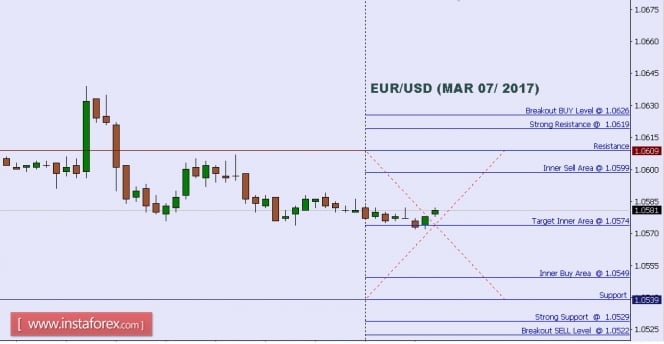
When the European market opens, some Economic Data will be released, such as Revised GDP q/q, French Gov Budget Balance and German Factory Orders m/m. The US will release the economic data, too, such as Consumer Credit m/m, IBD/TIPP Economic Optimism and Trade Balance, so, amid the reports, EUR/USD will move in a low to medium volatility during this day.
TODAY'S TECHNICAL LEVEL:
Breakout BUY Level: 1.0626.
Strong Resistance:1.0619.
Original Resistance: 1.0609.
Inner Sell Area: 1.0599.
Target Inner Area: 1.0574.
Inner Buy Area: 1.0549.
Original Support: 1.0539.
Strong Support: 1.0529.
Breakout SELL Level: 1.0522.
More analysis - at instaforex.com
-
Sponsored Links


 Reply With Quote
Thread Information
Users Browsing this Thread
There are currently 3 users browsing this thread. (0 members and 3 guests)
 Posting Permissions
24 Hour Gold

Advertising
- Over 20.000 UNIQUE Daily!
- Get Maximum Exposure For Your Site!
- Get QUALITY Converting Traffic!
- Advertise Here Today!
Out Of Billions Of Website's Online.
Members Are Online From.
- Get Maximum Exposure For Your Site!
- Get QUALITY Converting Traffic!
- Advertise Here Today!
Out Of Billions Of Website's Online.
Members Are Online From.


