
 LinkBack URL
 About LinkBacks
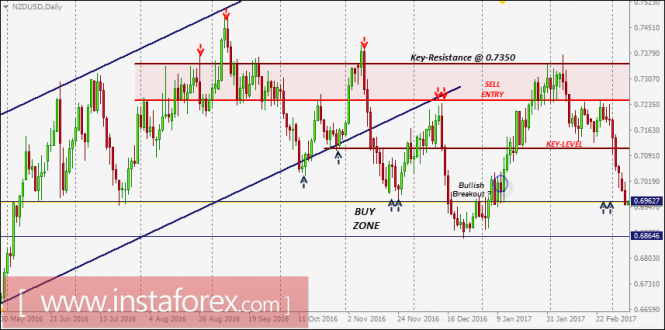
NZD/USD intraday technical levels and trading recommendations for March 8, 2017
On December 16, the price level of 0.6960 failed to apply enough bullish pressure. Instead, bearish movement continued toward the lower limit of the depicted BUY zone (0.6860) which provided significant bullish rejection on December 23.
The NZD/USD pair was trapped within the depicted price range (0.6860-0.6990) until a bullish breakout occurred.
A bullish breakout above 0.6960-0.7000 allowed the pair to head toward the price level of 0.7100 (Key level) which failed to provide sufficient bearish pressure on the pair.
Bullish persistence above 0.7100 allowed further bullish advance toward 0.7250-0.7350 (Sell-Zone) where the bearish price action should be expected.
Bearish persistence below 0.7250 is needed to allow further bearish decline toward 0.7100 (note the previous bearish DAILY candlesticks expressed within the SELL-Zone).
As anticipated, bearish persistence below 0.7100 (Key-Level) allows further bearish movement toward 0.6960 where bullish rejection should be watched for a possible BUY entry.
On the other hand, any bullish pullback towards 0.7100 should be watched for a valid SELL entry if enough bearish rejection is expressed.
More analysis - at instaforex.com
Please visit our sponsors
Results 2,261 to 2,270 of 4086
Thread: InstaForex Wave Analysis
-
08-03-2017, 08:35 AM #2261Senior Investor


- Join Date
- Jun 2012
- Posts
- 3,492
- Feedback Score
- 0
- Thanks
- 0
- Thanked 9 Times in 9 Posts

-
09-03-2017, 07:42 AM #2262Senior Investor
- Join Date
- Jun 2012
- Posts
- 3,492
- Feedback Score
- 0
- Thanks
- 0
- Thanked 9 Times in 9 Posts
Technical analysis of EUR/USD for Mar 09, 2017
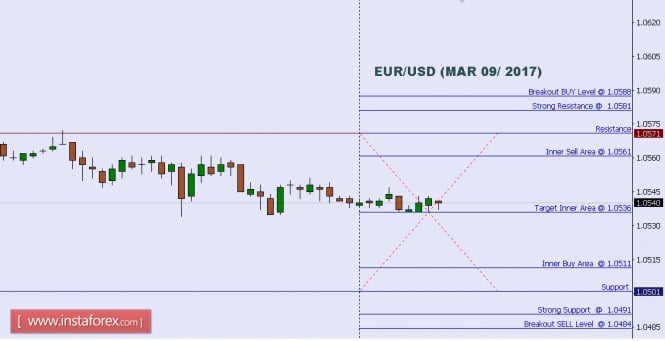
When the European market opens, some Economic Data will be released, such as Minimum Bid Rate and French Final Non-Farm Payrolls q/q. The US will release the economic data, too, such as Natural Gas Storage, Import Prices m/m, Unemployment Claims and Challenger Job Cuts y/y, so, amid the reports, EUR/USD will move in a medium volatility during this day.
TODAY'S TECHNICAL LEVEL:
Breakout BUY Level: 1.0588.
Strong Resistance:1.0581.
Original Resistance: 1.0571.
Inner Sell Area: 1.0561.
Target Inner Area: 1.0536.
Inner Buy Area: 1.0511.
Original Support: 1.0501.
Strong Support: 1.0491.
Breakout SELL Level: 1.0484.
More analysis - at instaforex.com
-
10-03-2017, 07:28 AM #2263Senior Investor
- Join Date
- Jun 2012
- Posts
- 3,492
- Feedback Score
- 0
- Thanks
- 0
- Thanked 9 Times in 9 Posts
Elliott wave analysis of EUR/JPY for March 10, 2017
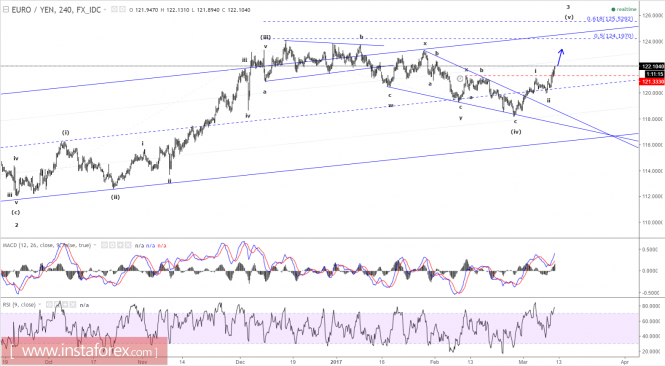
Wave summary:
EUR/JPY continues to higher toward the next upside target seen at 122.90 on the way higher to 124.20 and possibly even closer to 125.53 before wave 3 is complete. Short-term, we will ideally see minor support at 121.89 being able to protect the downside for the continuation higher to 122.90 and above.
R3: 122.90
R2: 122.53
R1: 122.25
Pivot: 122.00
S1: 121.89
S2: 121.75
S3: 121.25
Trading recommendation: WE are long EUR from 119.86 and will move our stop higher to 121.20. If you are not long EUR yet, then buy near 121.89 and use the same stop.
More analysis - at instaforex.com
-
13-03-2017, 07:51 AM #2264Senior Investor
- Join Date
- Jun 2012
- Posts
- 3,492
- Feedback Score
- 0
- Thanks
- 0
- Thanked 9 Times in 9 Posts
Daily analysis of USDX for March 13, 2017
USDX continues to find support around 101.39, while it's trying to consolidate below the 200 SMA at H1 chart. If the index does a rebound at the current stage, it can test the 102.39 level and such move could possibly strengthen the bullish bias in the short-term. However, if USDX plummets below 101.39, it can reach the 100.44 level.
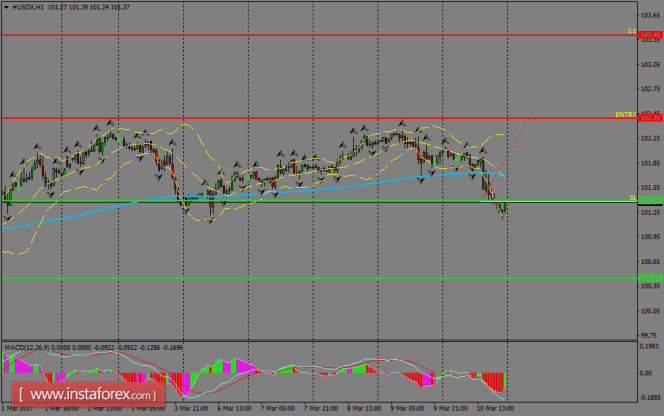
H1 chart's resistance levels: 102.39 / 103.40
H1 chart's support levels: 101.39 / 100.44
Trading recommendations for today: Based on the H1 chart, place buy (long) orders only if the USD Index breaks with a bullish candlestick; the resistance level is at 102.39, take profit is at 103.40 and stop loss is at 101.35.
More analysis - at instaforex.com
-
14-03-2017, 07:29 AM #2265Senior Investor
- Join Date
- Jun 2012
- Posts
- 3,492
- Feedback Score
- 0
- Thanks
- 0
- Thanked 9 Times in 9 Posts
Technical analysis of EUR/USD for Mar 14, 2017
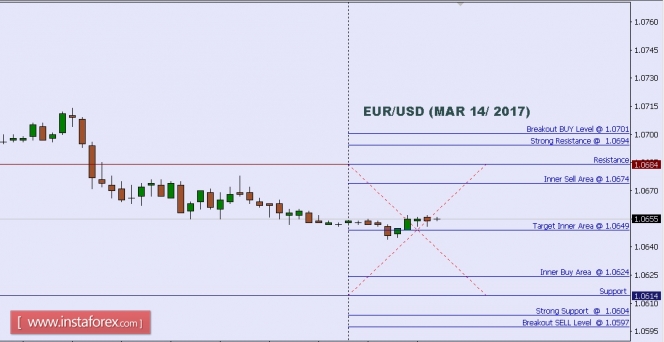
When the European market opens, some Economic Data will be released, such as ZEW Economic Sentiment, Industrial Production m/m, German ZEW Economic Sentiment, and German Final CPI m/m. The US will release the economic data, too, such as Core PPI m/m, PPI m/m, and NFIB Small Business Index, so, amid the reports, EUR/USD will move in a low to medium volatility during this day.
TODAY'S TECHNICAL LEVEL:
Breakout BUY Level: 1.0701.
Strong Resistance:1.0694.
Original Resistance: 1.0684.
Inner Sell Area: 1.0674.
Target Inner Area: 1.0649.
Inner Buy Area: 1.0624.
Original Support: 1.0614.
Strong Support: 1.0604.
Breakout SELL Level: 1.0597.
More analysis - at instaforex.com
-
15-03-2017, 07:33 AM #2266Senior Investor

- Join Date
- Aug 2012
- Posts
- 1,942
- Feedback Score
- 0
- Thanks
- 0
- Thanked 0 Times in 0 Posts
Technical analysis of USD/JPY for March 15, 2017
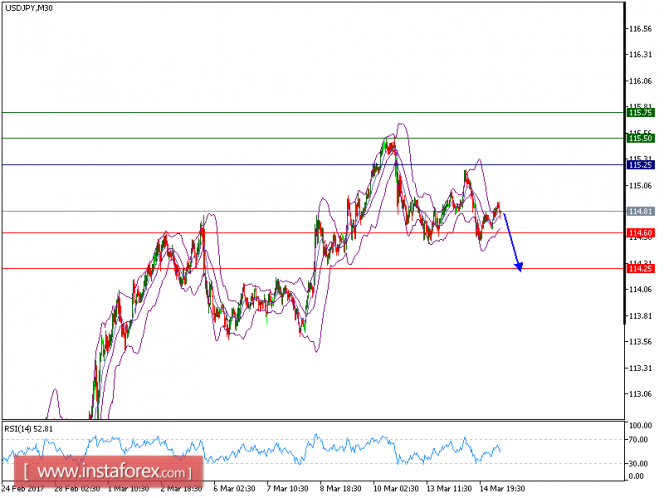
USD/JPY is under pressure. The pair is trading below its 50-period moving average and is testing the 20-period one. The relative strength index is below its neutrality level at 50. Additionally, 115.25 is playing a key resistance role, which should limit the upside potential.
As long as this key level holds on the upside, look for a further drop toward 114.60 and even 114.25 in extension.
The pair is trading below its pivot point. It is likely to trade in a lower range as long as it remains below the pivot point. Short positions are recommended with the first target at 114.60. A break below this target will move the pair further downwards to 114.25. The pivot point stands at 115.25. If the price moves in the opposite direction and bounces back from the support level, it will move above its pivot point. It is likely to move further to the upside. According to that scenario, long positions are recommended with the first target at 115.50 and the second one at 115.75.
Resistance levels: 115.50, 116.00, and 116.45
Support levels: 114.25, 113.80, and 113.35
More analysis - at instaforex.com
-
16-03-2017, 07:33 AM #2267Senior Investor
- Join Date
- Aug 2012
- Posts
- 1,942
- Feedback Score
- 0
- Thanks
- 0
- Thanked 0 Times in 0 Posts
Technical analysis of EUR/USD for Mar 16, 2017
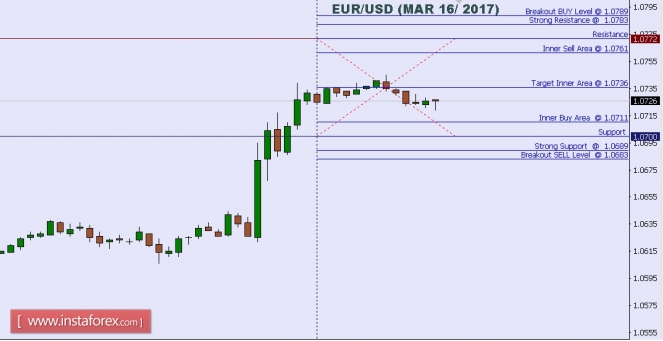
When the European market opens, some Economic Data will be released, such as Final Core CPI y/y, and Final CPI y/y. The US will release the economic data, too, such as Natural Gas Storage, JOLTS Job Openings, Housing Starts, Unemployment Claims, Philly Fed Manufacturing Index, and Building Permits, so, amid the reports, EUR/USD will move in a low to medium volatility during this day.
TODAY'S TECHNICAL LEVEL:
Breakout BUY Level: 1.0789.
Strong Resistance:1.0783.
Original Resistance: 1.0772.
Inner Sell Area: 1.0761.
Target Inner Area: 1.0736.
Inner Buy Area: 1.0711.
Original Support: 1.0700.
Strong Support: 1.0689.
Breakout SELL Level: 1.0683.
More analysis - at instaforex.com
-
17-03-2017, 08:54 AM #2268Senior Member

- Join Date
- Feb 2013
- Posts
- 212
- Feedback Score
- 0
- Thanks
- 0
- Thanked 0 Times in 0 Posts
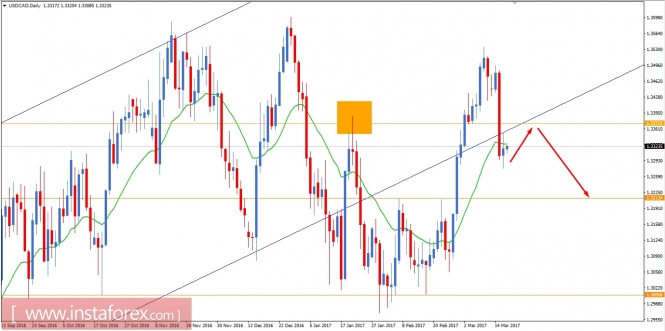
USD/CAD Fundamental Analysis March 17, 2017
The CAD had impulsive pressure over the USD after the FOMC decided to raise the federal funds rate from 0.75% to 0.75%-1.00%. Following a widely expected Fed's move, the rate hike decision made an huge impact on the currency market but affected the USD in a negative way. Currently, the USD/CAD market is trading sideways after the impulsive bearish move the day before yesterday. Today, we have G20 Meeting which is going to be underway for the whole global day. Therefore, the USD/CAD pair may show some volatility along the way. Moreover, today Canada will present Manufacturing Sales report. Previously, the figure was at 2.3% but no forecast has been made about this report. Any positive or negative outcome will affect the CAD in an impulsive way today. On the other hand, today on the USD front, the economic calendar contains Preliminary UoM Consumer Sentiment which previously was at 96.3 and 97.1 is expected today. On the whole, the currency market is going to be quite volatile today. Amid some important first-tier reports from the US and Canada, the USD/CAD pair is facing a choppy trade today.
Now let us look at the technical view. After the break below the channel support and dynamic support of 20 EMA the pair is expected to retest the nearest resistance of 1.3370. If we see any bullish rejection from the level, we will consider selling with a target towards 1.3215. On the other hand, daily close above the resistance 1.3370 will cancel the bearish bias.
InstaForex analytical reviews will make you fully aware of market trends!
Being an InstaForex client, you are provided with a large number of free services for efficient trading.
More analysis - at instaforex.com
-
20-03-2017, 07:41 AM #2269Senior Investor
- Join Date
- Aug 2012
- Posts
- 1,942
- Feedback Score
- 0
- Thanks
- 0
- Thanked 0 Times in 0 Posts
Technical analysis of USD/JPY for March 20, 2017
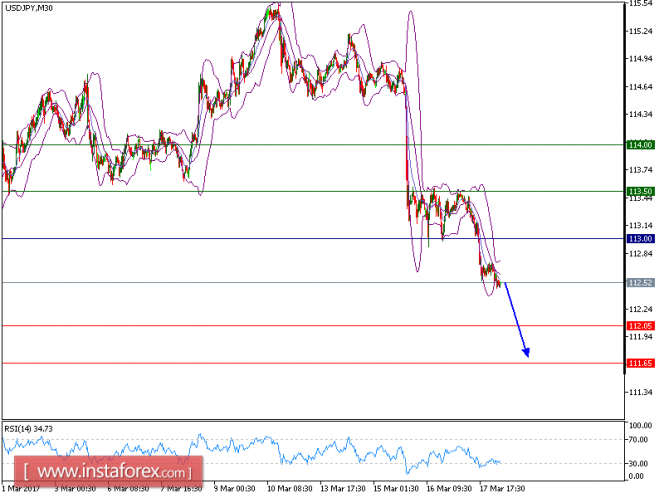
USD/JPY is expected to prevail its downside movement. The pair is trading below its declining 20-period and 50-period moving averages, which play resistance roles and maintain the downside bias, and is consolidating on the downside. The relative strength index is below its neutrality level at 50 and lacks upward momentum.
As long as 113.00 holds on the upside, look for a further drop toward 112.05 and even 111.65 in extension.
The pair is trading below its pivot point. It is likely to trade in a lower range as long as it remains below the pivot point. Short positions are recommended with the first target at 112.05. A break below this target will move the pair further downwards to 111.65. The pivot point stands at 113.00. If the price moves in the opposite direction and bounces back from the support level, it will move above its pivot point. It is likely to move further to the upside. According to that scenario, long positions are recommended with the first target at 113.50 and the second one at 114.00.
Resistance levels: 113.50, 114.00, and 114.45
Support levels: 112.05, 111.65, and 111.25
More analysis - at instaforex.com
-
21-03-2017, 07:48 AM #2270Senior Investor
- Join Date
- Aug 2012
- Posts
- 1,942
- Feedback Score
- 0
- Thanks
- 0
- Thanked 0 Times in 0 Posts
Technical analysis of GBP/JPY for March 21, 2017
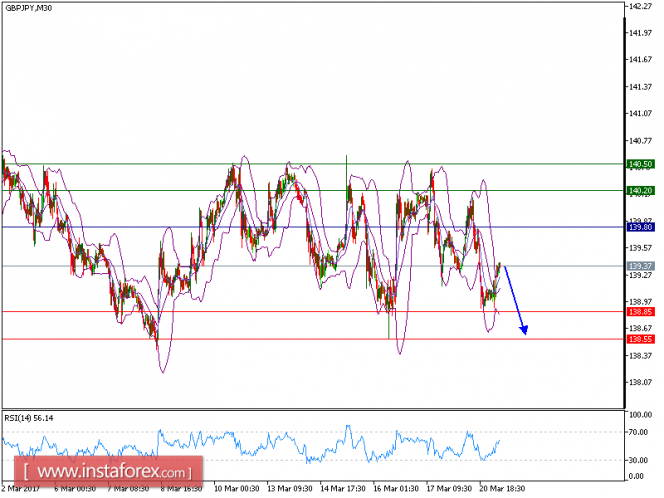
GBP/JPY is expected to trade in the lower range. The pair remains capped by its descending 20-period moving average, which has again crossed below the 50-period moving average. Meanwhile, the relative strength index stays below its neutrality area at 50 and has broken down the 30 level. The intraday trend remains negative.
As long as 139.80 holds as the key resistance, expect a drop to the nearest support at 138.85 at first. A break below 138.85 allows for the further drop to 138.55 as likely.
The pair is trading below its pivot point. It is likely to trade in a lower range as long as it remains below the pivot point. Short positions are recommended with the first target at 138.85. A break below this target will move the pair further downwards to 138.55. The pivot point stands at 139.80. If the price moves in the opposite direction and bounces back from the support level, it will move above its pivot point. It is likely to move further to the upside. According to that scenario, long positions are recommended with the first target at 140.20 and the second one at 140.50.
Resistance levels: 140.20, 140.50, and 140.95
Support levels: 138.85,138.55, and 138.00
More analysis - at instaforex.com
-
Sponsored Links


 Reply With Quote
Thread Information
Users Browsing this Thread
There are currently 1 users browsing this thread. (0 members and 1 guests)
 Posting Permissions
24 Hour Gold

Advertising
- Over 20.000 UNIQUE Daily!
- Get Maximum Exposure For Your Site!
- Get QUALITY Converting Traffic!
- Advertise Here Today!
Out Of Billions Of Website's Online.
Members Are Online From.
- Get Maximum Exposure For Your Site!
- Get QUALITY Converting Traffic!
- Advertise Here Today!
Out Of Billions Of Website's Online.
Members Are Online From.


