
 LinkBack URL
 About LinkBacks
Forex charts are an essential tool for traders to make informed decisions and execute profitable trades. Reading forex charts might seem overwhelming to novice traders, but it becomes easier with practice and familiarity with the various charting tools and techniques.
Forex charts represent the price movements of currency pairs over a specified period. The most commonly used type of chart in forex trading is the candlestick chart, which provides traders with detailed information about price movements.
Here is a step-by-step guide on how to read a forex chart:
- Currency Pair: The first step is to identify the currency pair you want to analyze. The currency pair is shown at the top of the chart, with the base currency on the left and the quote currency on the right.
- Timeframe: The next step is to choose a timeframe. Forex charts can be displayed in different timeframes, such as 1 minute, 5 minutes, 15 minutes, 1 hour, 4 hours, daily, weekly, and monthly.
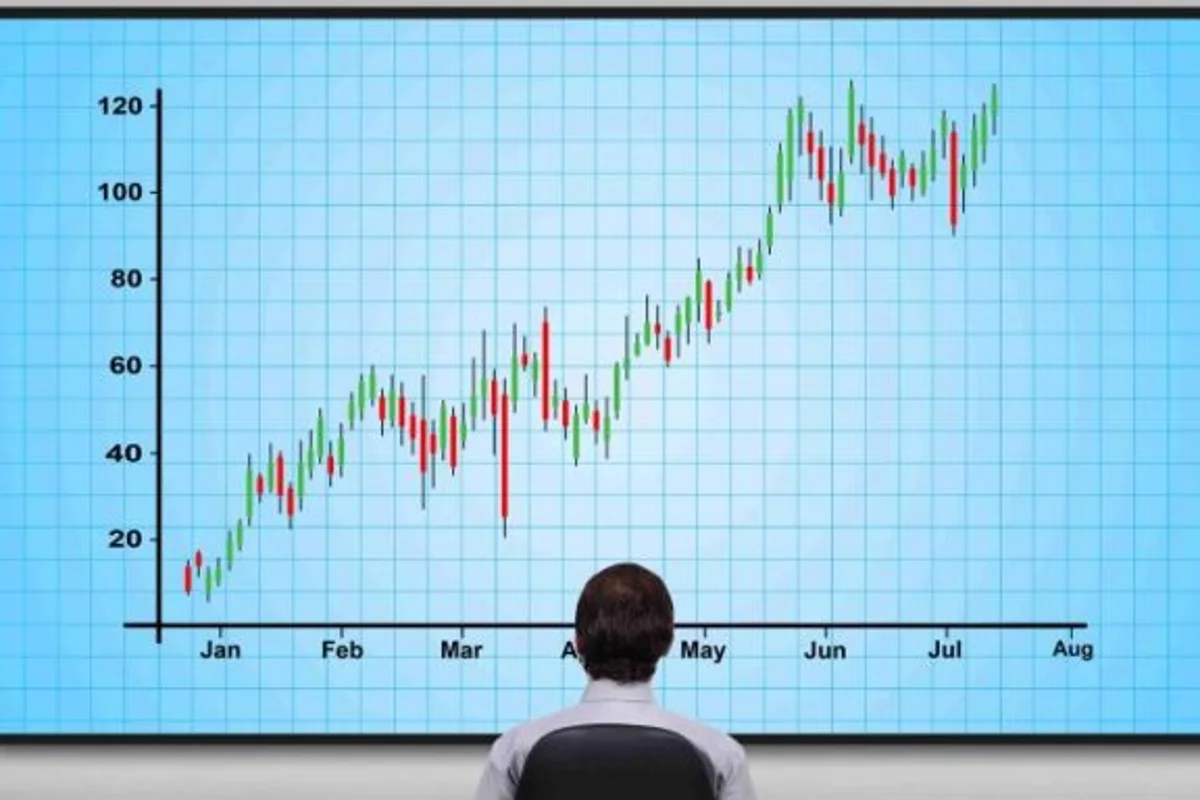
- Candlesticks: The candlesticks on a forex chart represent the price movements of the currency pair over the chosen timeframe. Each candlestick consists of a body and two wicks. The body represents the opening and closing price of the currency pair, while the wicks represent the high and low prices.
- Colors: The color of the candlestick can indicate whether the price has gone up or down during the timeframe. A green or white candlestick indicates that the closing price was higher than the opening price, while a red or black candlestick indicates that the closing price was lower than the opening price.
- Support and Resistance Levels: Support and resistance levels are key levels on the chart where the price tends to stall or reverse. Support levels are below the current price, and resistance levels are above the current price. Traders use support and resistance levels to identify potential entry and exit points.
- Indicators: Forex charts can also include technical indicators, such as moving averages, Bollinger Bands, and Relative Strength Index (RSI). These indicators help traders to identify trends, momentum, and potential buy and sell signals.
- Volume: Volume is an important indicator that shows the level of market activity. High volume indicates that there is significant interest in the currency pair, while low volume indicates the opposite.
Reading forex charts is not only about identifying the price movements of a currency pair but also about understanding the context and market conditions that are affecting the price movements. It requires practice, experience, and knowledge of technical analysis and fundamental analysis.
Forex charts are essential tools for traders to make informed decisions and execute profitable trades. By understanding the basics of how to read a forex chart, traders can gain valuable insights into market trends, support and resistance levels, technical indicators, and volume.
Please visit our sponsors
Results 1 to 6 of 6
Thread: How do you read a forex chart?
-
20-03-2023, 01:18 PM #1Investor

- Join Date
- Feb 2020
- Location
- Khulna,Bangladesh
- Posts
- 360
- Feedback Score
- 0
- Thanks
- 0
- Thanked 0 Times in 0 Posts
 How do you read a forex chart?
Trade With A Lightning Fast Platform - AssetsFX
How do you read a forex chart?
Trade With A Lightning Fast Platform - AssetsFX
-
Sponsored Links
-
24-04-2023, 04:40 AM #2Senior Investor

- Join Date
- Dec 2019
- Posts
- 2,108
- Feedback Score
- 0
- Thanks
- 0
- Thanked 0 Times in 0 Posts
There are so many important things in forex, and by frequently studying and practicing, one can gain a deeper understanding of forex and trade better on a real account with Tickmill as the broker.
-
30-04-2023, 12:19 PM #3Investor
- Join Date
- Feb 2020
- Location
- Khulna,Bangladesh
- Posts
- 360
- Feedback Score
- 0
- Thanks
- 0
- Thanked 0 Times in 0 Posts
A Forex chart shows the price movements of a currency pair over a specific period. It consists of a timeframe, price axis, candlesticks or bars, trend lines, and indicators. Traders use charts to identify trends and trading opportunities, along with other factors such as economic news and market sentiment to make informed trading decisions.
Trade With A Lightning Fast Platform - AssetsFX
-
02-05-2023, 04:46 AM #4Senior Investor

- Join Date
- Jul 2011
- Location
- www.ArmadaMarkets.com
- Posts
- 4,135
- Feedback Score
- 0
- Thanks
- 0
- Thanked 2 Times in 2 Posts
There are many things to consider in forex trading, which is why I continue to strive to learn everything about forex. That's why I participate in education programs offered by Tickmill, where I can deepen my understanding of the forex market and other related topics.
-
09-05-2023, 01:21 PM #5Investor
- Join Date
- Feb 2020
- Location
- Khulna,Bangladesh
- Posts
- 360
- Feedback Score
- 0
- Thanks
- 0
- Thanked 0 Times in 0 Posts
Forex charts are important tools that show the price movements of currency pairs over a specific time period. The most commonly used chart is the candlestick chart, which displays opening and closing prices, highs and lows, and trends. By understanding how to read a forex chart, traders can gain valuable insights into market conditions, support and resistance levels, technical indicators, and volume.
Trade With A Lightning Fast Platform - AssetsFX
-
09-05-2023, 04:37 PM #6Senior Investor
- Join Date
- Jul 2011
- Location
- www.ArmadaMarkets.com
- Posts
- 4,135
- Feedback Score
- 0
- Thanks
- 0
- Thanked 2 Times in 2 Posts
For us to be able to carry out good trading in learning, of course, the trading skills that we have will be even better. And indeed there is a very big risk in forex, so for that a trader must run a good trade step by step with an understanding of forex to run it to the fullest, and the Tickmill demo account can be used as a tool for us to practice running the trade well
-
Sponsored Links


 Reply With Quote
Thread Information
Users Browsing this Thread
There are currently 1 users browsing this thread. (0 members and 1 guests)
 Posting Permissions
24 Hour Gold

Advertising
- Over 20.000 UNIQUE Daily!
- Get Maximum Exposure For Your Site!
- Get QUALITY Converting Traffic!
- Advertise Here Today!
Out Of Billions Of Website's Online.
Members Are Online From.
- Get Maximum Exposure For Your Site!
- Get QUALITY Converting Traffic!
- Advertise Here Today!
Out Of Billions Of Website's Online.
Members Are Online From.


