
 LinkBack URL
 About LinkBacks
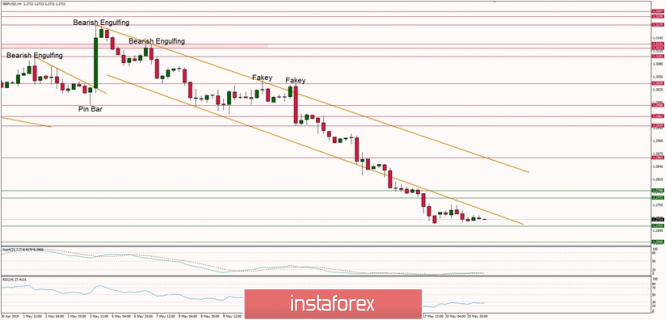
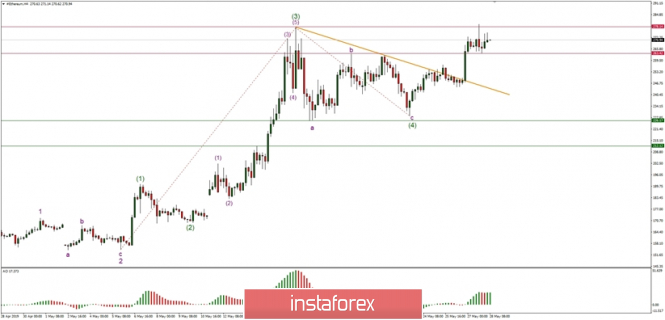
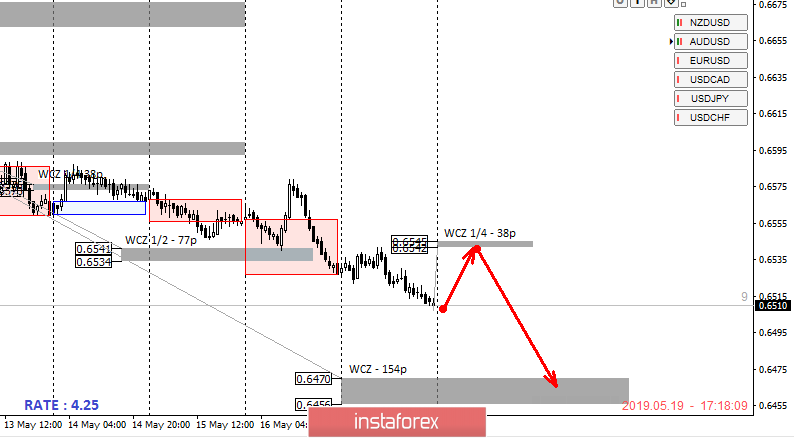
Control zones NZDUSD 05/20/19
The downward movement is a medium-term impulse, so selling is still a priority. It is not profitable to sell on Monday from current grades, since the target of the fall is the weekly CZ of 0.6470-0.6456. Any growth should be used as an opportunity to sell the pair. The first resistance will be WCZ 1/4 06545-0.6542.
The downward trend is so strong that it will be possible to look for opportunities for buying only if a daily absorption takes place and the US session closes above Friday's maximum. This model will be the starting point in the formation of a deep correctional model, the next goal of which will be WCZ 1/2 0.6584-0.6577. While the pair will be trading below the specified zone, the bearish trend will not turn.
Daily CZ - daily control zone. The area formed by important data from the futures market, which change several times a year.
Weekly CZ - weekly control zone. The zone formed by important marks of the futures market, which change several times a year.
Monthly CZ - monthly control zone. The zone, which is a reflection of the average volatility over the past year.
Analysis are provided byInstaForex.
Please visit our sponsors
Results 2,781 to 2,790 of 4086
Thread: InstaForex Wave Analysis
-
20-05-2019, 05:10 AM #2781Senior Investor


- Join Date
- Aug 2012
- Posts
- 1,942
- Feedback Score
- 0
- Thanks
- 0
- Thanked 0 Times in 0 Posts

-
21-05-2019, 06:51 AM #2782Senior Investor
- Join Date
- Aug 2012
- Posts
- 1,942
- Feedback Score
- 0
- Thanks
- 0
- Thanked 0 Times in 0 Posts
Technical analysis of EUR/USD for 21.05.2019
Technical Market Overview:
After making the local low at the level of 1.1150, the EUR/USD pair has tried to bounce or even rally higher, but this attempt was capped at the technical resistance zone located between the levels of 1.1167 - 1.1173 and the price reversed. The short-term outlook remains bearish and there is no signs or any trend reversal for now. The next target for bears is seen at the level of 1.1111.
Weekly Pivot Points:
WR3 - 1.1317
WR2- 1.1287
WR1 - 1.1208
Weekly Pivot - 1.1178
WS1 - 1.1099
WS2 - 1.1069
WS3 - 1.0986
Trading Recommendations:
The best trading strategy in the current market conditions is to sell the local pull-backs with a tight protective stop loss. Due to the oversold market conditions please pay attention to the candlestick trend reversal patterns and market trend reversal patterns. The next important technical support is located at the level of 1.1111 and this is the next target for bears.
Analysis are provided byInstaForex.
-
22-05-2019, 08:10 AM #2783Senior Member

- Join Date
- Feb 2013
- Posts
- 212
- Feedback Score
- 0
- Thanks
- 0
- Thanked 0 Times in 0 Posts
Technical analysis of EUR/USD for 22.05.2019
Technical Market Overview:
The EUR/USD market is still hovering around the technical resistance zone located between the levels of 1.1167 - 1.1174 with no intention of breaking higher so far. There were some attempts to rally but were quickly capped by the bears. The short-term outlook remains bearish and there is no signs or any trend reversal for now. The next target for bears is seen at the level of 1.1135 and 1.1111.
Weekly Pivot Points:
WR3 - 1.1317
WR2- 1.1287
WR1 - 1.1208
Weekly Pivot - 1.1178
WS1 - 1.1099
WS2 - 1.1069
WS3 - 1.0986
Trading Recommendations:
The best trading strategy in the current market conditions is to sell the local pull-backs with a tight protective stop loss. Due to the oversold market conditions please pay attention to the candlestick trend reversal patterns and market trend reversal patterns. The next important technical support is located at the level of 1.1111 and this is the next target for bears.
*The market analysis posted here is meant to increase your awareness, but not to give instructions to make a trade.
-
23-05-2019, 05:19 AM #2784Senior Investor
- Join Date
- Aug 2012
- Posts
- 1,942
- Feedback Score
- 0
- Thanks
- 0
- Thanked 0 Times in 0 Posts
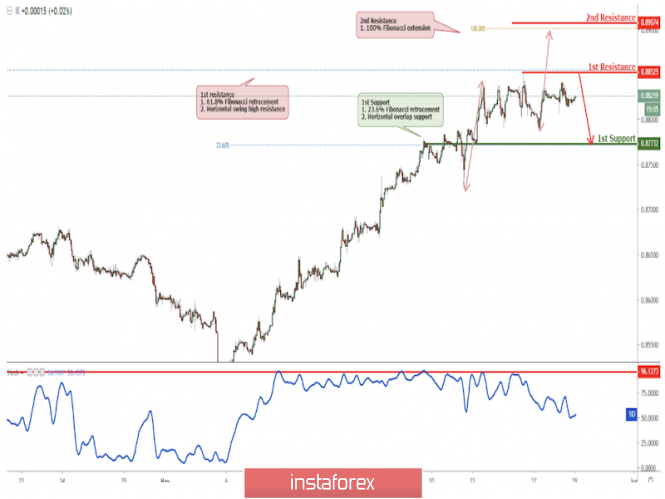
EUR/GBP approaching resistance, potential drop!
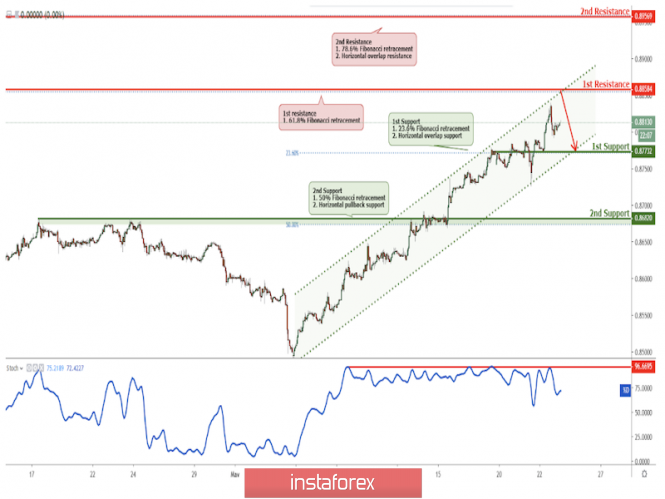
Price is approaching our first resistance level.
Entry : 0.8858 Why it's good : 61.8% Fibonacci retracement, channel's resistance
Stop Loss : 0.8956 Why it's good : horizontal overlap resistance, 78.6% Fibonacci retracement
Take Profit : 0.8773
Why it's good :23.6% Fibonacci retracement, horizontal overlap support
Analysis are provided byInstaForex.
-
27-05-2019, 06:10 AM #2785Senior Investor
- Join Date
- Aug 2012
- Posts
- 1,942
- Feedback Score
- 0
- Thanks
- 0
- Thanked 0 Times in 0 Posts
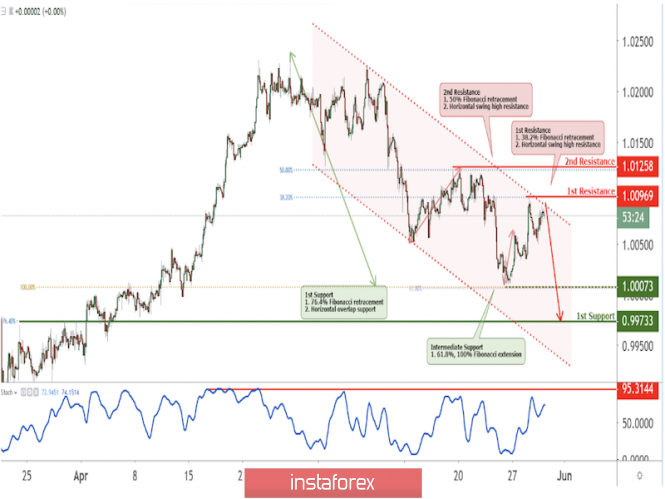
EUR/USD approaching resistance, potential drop!
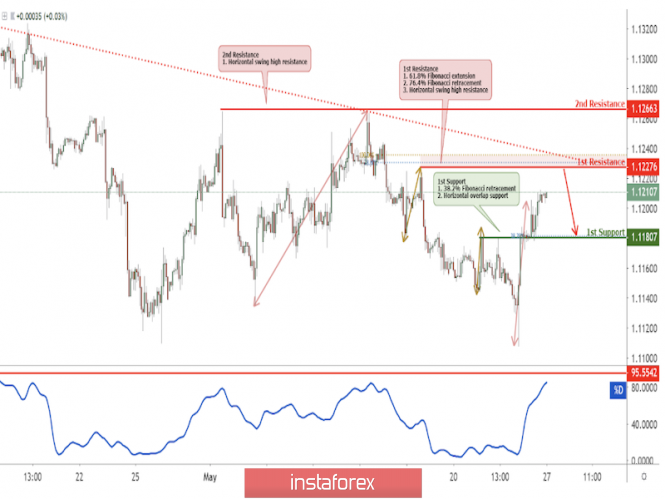
Price is approaching our first resistance level.
Entry : 1.1227
Why it's good : 76.4% Fibonacci retracement, descending resistance line, 61.8% Fibonacci extension
Stop Loss : 1.1266 Why it's good : horizontal swing high resistance
Take Profit : 1.1180
Why it's good : 38.2% Fibonacci retracement, horizontal overlap support
Analysis are provided byInstaForex.
-
28-05-2019, 06:43 AM #2786Senior Investor
- Join Date
- Aug 2012
- Posts
- 1,942
- Feedback Score
- 0
- Thanks
- 0
- Thanked 0 Times in 0 Posts
Technical analysis of ETH/USD for 28.05.2019
Crypto Industry News:
One of the largest peer-to-peer cryptocurrencies, LocalBitcoins.com, has banned users living in Iran, according to information published on the company's website.
The source previously informed the financial media in an e-mail that the impulse to limit Iranian transactions was to comply with financial regulations in Finland, where the headquarters of LocalBitcoins.com is located. In addition, the stock exchanges allegedly cut off users from Iran because of sanctions previously imposed on other exchanges by the United States.
Coinbase and Binance cryptocurrency exchanges do not currently support users residing in Iran as well.
Technical Market Overview:
The ETH/USD pair might have completed wave (4) and now the market is unfolding the wave (5) to the upside, but the momentum behind the move up is still low. The target for this wave is seen at the level of $304. For now, the market is consolidating the recent gains in a narrow range between the levels of $278.14 - $263.42 as the market participants wait for the breakout.
Weekly Pivot Points:
WR3 - $321.20
WR2 - $292.77
WR1 - $283.99
Weekly Pivot - $254.33
WS1 - $241.65
WS2 - $213.82
WS3 - $203.55
Trading Recommendations:
The best trading strategy in the current market conditions is to buy the local pull-back as wave 4 is in progress in anticipation of the wave 5 to the upside. Please pay attention to the technical resistance at the level of $278.14 as any breakout above this level is bullish. On the other hand, any violation of the level of $226.17 will accelerate the sell-off towards the next technical support at the level of $212.12.
Analysis are provided byInstaForex.
-
29-05-2019, 06:21 AM #2787Senior Investor
- Join Date
- Aug 2012
- Posts
- 1,942
- Feedback Score
- 0
- Thanks
- 0
- Thanked 0 Times in 0 Posts
EUR/GBP approaching resistance, potential drop!
EURGBP approaching resistance, potential drop!
Description :
Price is approaching our first resistance level.
Entry : 0.8852
Why it's good : Horizontal swing high resistance, 61.8% Fibonacci retracement
Stop Loss : 0.8907
Why it's good : 100% Fibonacci extension
Take Profit : 0.8773
Why it's good : 23.6% Fibonacci retracement, horizontal overlap support
Analysis are provided byInstaForex.
-
30-05-2019, 06:22 AM #2788Senior Investor
- Join Date
- Aug 2012
- Posts
- 1,942
- Feedback Score
- 0
- Thanks
- 0
- Thanked 0 Times in 0 Posts
USD/CHF approaching resistance, potential drop!
Price is approaching our first resistance level.
Entry : 1.0096
Why it's good : Horizontal swing high resistance, 38.2% Fibonacci retracement
Stop Loss : 1.0125
Why it's good : Horizontal swing high resistance, 50% Fibonacci retracement
Take Profit : 0.9973
Why it's good : 76.4% Fibonacci retracement, horizontal overlap support
Analysis are provided byInstaForex.
-
31-05-2019, 05:22 AM #2789Senior Investor
- Join Date
- Aug 2012
- Posts
- 1,942
- Feedback Score
- 0
- Thanks
- 0
- Thanked 0 Times in 0 Posts
GBP/JPY approaching support, big potential bounce coming!!
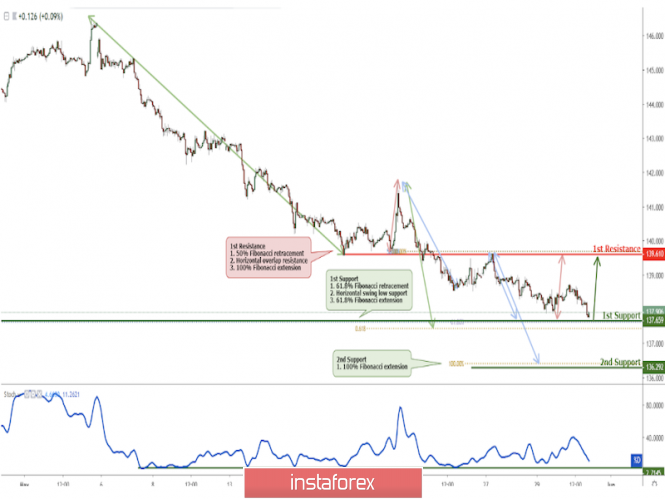
Price is approaching our first support level.
Entry : 137.65
Why it's good : Horizontal swing low support, 61.8% Fibonacci retracement, 61.8% Fibonacci extension
Stop Loss : 136.29
Why it's good : 100% Fibonacci extension
Take Profit : 139.61
Why it's good : 50% Fibonacci retracement, horizontal overlap resistance, 100% Fibonacci extension
Analysis are provided byInstaForex.
-
03-06-2019, 05:11 AM #2790Senior Investor
- Join Date
- Aug 2012
- Posts
- 1,942
- Feedback Score
- 0
- Thanks
- 0
- Thanked 0 Times in 0 Posts
Another failed attempt of the Dollar index capture the 98 price level.
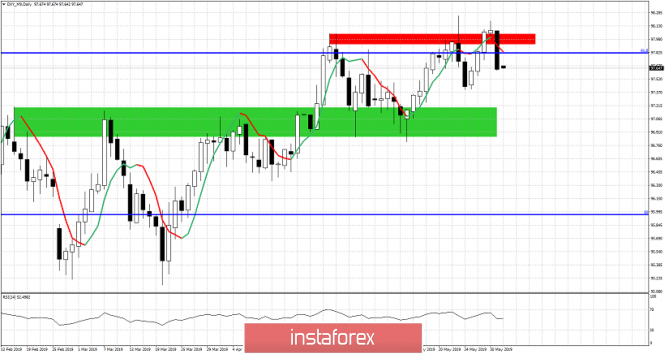
The Dollar index ended last week on a mixed to bearish note as price recaptured the critical resistance at the 98 price level only to lose it with a big decline on the last trading day of the week.
Red rectangle - major resistance
Green rectangle - major support
The Dollar index made new highs on May 23rd but price reversed and did not close above 98. On May 29th and 30th we saw new higher highs but on a closing basis above the major resistance area depicted with a red rectangle. However on the last trading day we saw another reversal. The inability to break above 98 and stay above it, is a worrying sign for bulls. However as long as price is trading above the green rectangle, bulls remain in control of the trend. The many failed attempts point to a bigger reversal in trend, taking into consideration how much time has the index around 98 which is the 61.8% Fibonacci retracement of the entire decline from 103.75 to 88.
Analysis are provided byInstaForex.
-
Sponsored Links


 Reply With Quote
Thread Information
Users Browsing this Thread
There are currently 1 users browsing this thread. (0 members and 1 guests)
 Posting Permissions
24 Hour Gold

Advertising
- Over 20.000 UNIQUE Daily!
- Get Maximum Exposure For Your Site!
- Get QUALITY Converting Traffic!
- Advertise Here Today!
Out Of Billions Of Website's Online.
Members Are Online From.
- Get Maximum Exposure For Your Site!
- Get QUALITY Converting Traffic!
- Advertise Here Today!
Out Of Billions Of Website's Online.
Members Are Online From.


