
 LinkBack URL
 About LinkBacks
About Conflux
Conflux is an open blockchain network with an economic incentive-based governance mechanism designed to reward community members who contribute to ensuring a safe, stable, and predictable environment for economic activity. Conflux is focused on developing decentralized applications (dApps), creating smart contracts, and making simple payments. In simple words, Conflux is an exact copy of all known Ethereum, but more scalable and flexible.
Conflux history
Conflux is headquartered in Beijing, China. The Financial office was registered in Singapore in 2018.
Developers raised initial funds by selling the part of 1 billion CFX tokens issued on the Ethereum blockchain. After the launch of the main Conflux network, the developers generated 5 billion CFX tokens (most of them are still frozen) and launched the mechanism of additional emission of CFX coins (internal tokens of the Conflux network) available to earn by miners and stakers.
CFX is the main fuel of the Conflux platform and is used as a tool to interact with solutions in the Conflux Network ecosystem. Major CFX holders include venture giants such as Sequoia China, Huobi Group, Shunwei, and Rong 360.
Token holders receive a reward for their storage depending on the staking time.
Conflux features
The Conflux network has many advantages.
- The throughput is 4000 transactions per second (for comparison, Ethereum has 15).
- Proof of work algorithm, which means the cryptocurrency is available for mining on video cards.
- Unlike many other blockchains (for example, Bitcoin, Ethereum), in which blocks are generated sequentially, one after another, in the Conflux blockchain network, parallel construction of a blockchain and transactions is possible.
- Ethereum virtual machine support, so smart contracts can be ported from Ethereum to Conflux Network.
- Block generation time - 2 blocks per second (172, 800 blocks per day).
- Annual inflation is at 8.83%.
Conclusion
The main goal of the Conflux blockchain network is the development of digital technologies. Creators used Bitcoin and Ethereum’s developments as well as other innovative technologies to create a high-quality cryptosystem.
Despite this, Conflux is a young project, comparing with such giants as Litecoin, Bitcoin, Ripple, and Ethereum, which already recommended themselves as a reliable cryptosystem. That’s why we suppose the risk of trading CFX remains on a high level and suggest trading more sustainable coins such as XRP, ETH, BTC, and LTC.
Please visit our sponsors
Results 31 to 40 of 40
Thread: Daily News
-
15-09-2021, 11:17 PM #31Senior Investor

- Join Date
- Apr 2018
- Posts
- 509
- Feedback Score
- 0
- Thanks
- 0
- Thanked 0 Times in 0 Posts

-
21-09-2021, 02:34 PM #32Senior Investor
- Join Date
- Apr 2018
- Posts
- 509
- Feedback Score
- 0
- Thanks
- 0
- Thanked 0 Times in 0 Posts
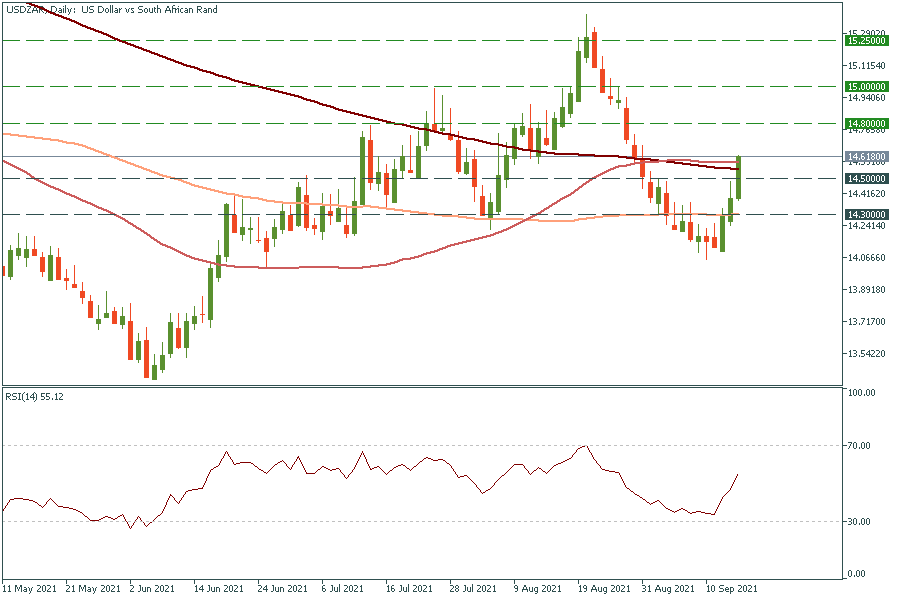
USD/ZAR is mainly driven by the US dollar, that’s why the US economic data is highly impactful. The US has published strong retail sales for August. It pleasantly surprised investors as they were concerned that consumers would limit their purchases amid the spread of the Delta virus strain. However, retail sales posted a gain!
In comparison, South Africa's July retail sales (the freshest data so far) revealed a significant -11.2% year-on-year, versus market expectations for -2.7%. Such a huge drop was caused by the jailing of former president Jacob Zuma, which lead to the escalation of civil unrest.
Technical outlook
USD/ZAR has been rising at a quite fast pace for the last three days. It has even broken through all three moving averages: 50-, 100-, and 200-day. The growth has been too quick though, we might expect a retracement (correction) to the support level of 14.50. However, the rally may continue till the price reaches the highs of early August at 14.80. The breakout above this resistance level will lead the pair to the psychological mark of 15.00.
Reference: FBSN (16.09.2021) Greatest sale of South African Rand. FBS Analytic news.
-
21-09-2021, 02:37 PM #33Senior Investor
- Join Date
- Apr 2018
- Posts
- 509
- Feedback Score
- 0
- Thanks
- 0
- Thanked 0 Times in 0 Posts
GBP/USD is moving inside the ascending channel. Since it’s in the lower part of this channel, the pair should reverse up and continue moving in zig-zag.
Short term
However, fundamental factors ruined that plans. The UK has published poor retail sales for August. Analysts forecasted the 0.5% growth, while the actual numbers showed a drop of 0.9%. Thus, the pair is moving back and forth near 1.3785 as technical and fundamental factors are opposite in the short term.
Long term
On Wednesday, the report revealed that the UK inflation reached a 9 year high in August, so the Bank of England can start taking actions earlier than the markets expect. The bank may start discussing the tightening: hint at hiking rates or cutting bond buys. If it happens, the GBP will surge.
Tech outlook
The long lower tails signal us that bears were trying to push the price lower, but by the end of the sessions more bulls appeared, and they pushed the price higher. In other words, lower prices were rejected, so the price moved up. That’s why the price is likely to go up in the next session as well.
Thus, we might assume if the pair manages to close above the 23.6% Fibonacci retracement level of 1.3810, it may jump to the next round number of 1.3825 near the 38.2% Fibo level. Support levels are the recent lows of 1.3780 and 1.3750.

Reference: FBS (17.09.2021) GBP/USD Is ready for reverse up. FBS analytic news.
-
27-09-2021, 04:10 PM #34Senior Investor
- Join Date
- Apr 2018
- Posts
- 509
- Feedback Score
- 0
- Thanks
- 0
- Thanked 0 Times in 0 Posts
What happened?
It’s unbelievable but China’s government prohibited all transactions with cryptocurrencies (yes, even Bitcoin) and promised to stop illegal crypto mining. While the rest of the world is taking steps to include crypto into the economy, China denies it.
What does China mean for crypto?
China is home to a huge part of the world’s crypto miners. As we know, mining requires a lot of energy resources and it prevents China from curbing greenhouse-gas emissions. Bloomberg says 46% of the global hash rate (computing power used in mining) occurred in China in April.
What will be the circumstances?
It is a negative factor for the whole crypto market in the short term. Today, BTC/USD has dropped by 3168 points in one day. The downtrend is likely to stay with us for longer. So good that FBS traders can open both buy and sell trades. Besides, it can be also a negative factor for chip producers such as Nvidia and AMD as demand for GPUs is going to drop in China and press the prices of GPUs down.
Tech outlook
Bitcoin has dropped to the support level of $41,000, which lies at the 50-day moving average and the 50% Fibonacci level. It makes this level a strong barrier, which the cryptocurrency will struggle to break on the first try. If it manages to cross, BTC/USD will plunge to the 61.8% Fibo level of $38,000. Resistance levels are $44,000 and $45,500 (the 200-day moving average).

Reference: FBS (24.09.2021) Crypto becomes illegal in China. FBS analytic news.
-
06-10-2021, 12:49 PM #35Senior Investor
- Join Date
- Apr 2018
- Posts
- 509
- Feedback Score
- 0
- Thanks
- 0
- Thanked 0 Times in 0 Posts
Like oil, natural gas is a product of decomposed organic matter, typically from ancient marine microorganisms, deposited over the past 550 million years. Often, gas and oil are neighbors, who are located deep under the ground. Because of that, their prices sometimes correlate. But for the last several weeks gas was skyrocketing at an enormous pace. It has gained more than 17% from August 18. What is the reason for such moves and how can we earn on global gas trading?
Latest news:- Hurricane Ida shut down oil and gas production.
- OPEC+ meeting is expected to stall oil production increase.
- Natural gas prices have risen sharply over the past week, with futures hitting two-year highs due to rising inflation and continued production cuts.
What affects the gas price?
Assessment of the Natural Gas market should start with basic points. Usually, there are a set of reasons for the commodity price to change:
- The law of supply and demand regulates prices, as it does in nearly all commodities.
- As a longer-term general trend, the supply of high-quality oil and gas is fixed while global demand is increasing with a rising population and economic growth.
- There is a growing consensus that the world is facing a structural shift, driven by the energy transition and companies’ desire to reduce their carbon footprint.
Let’s go through every reason to create a natural gas price forecast. As for now, demand isn’t showing any signs of slowing down. Between 2009 and 2020, global gas consumption surged by 30% as utilities and industries took advantage of booming output. Even in the covid-19 environment, experts are expecting the demand to rise even more in the next 10 years.
As for ecological reasons, companies and countries are implementing gas in their electrical supplies. The shift to natural gas can be done relatively quickly and cheaply while having a significant impact on lowering emissions. Natural gas is the cleanest burning fossil fuel and emits almost 50% less CO2 than coal. Meanwhile, non-fossil-fuel alternatives such as wind and solar are at a relatively early stage to produce enough energy and offer a cheap deployment.
Gas’ bright future
Already, there are signs around the world that supplies will fall short:
- Beyond a massive expansion in Qatar, few new liquified natural gas (LNG) export projects have been started since 2020.
- Government is uncertain about emissions-reducing policies, thus, producers have been less willing to sign long-term supply deals.
- Key pipeline projects struggle to move forward, and drillers are under pressure from investors, that want to avoid a surplus of gas. Moreover, major producers of natural gas are having too much power in their hands. That gives them the opportunity to control prices remove weaker competitors.
Even if the prices will rise even higher over the next decade, it won’t be enough to drastically reduce demand for the fuel. All we can say for now is that gas is increasingly less dependent on oil prices and this trend is going to continue.
Technical analysis
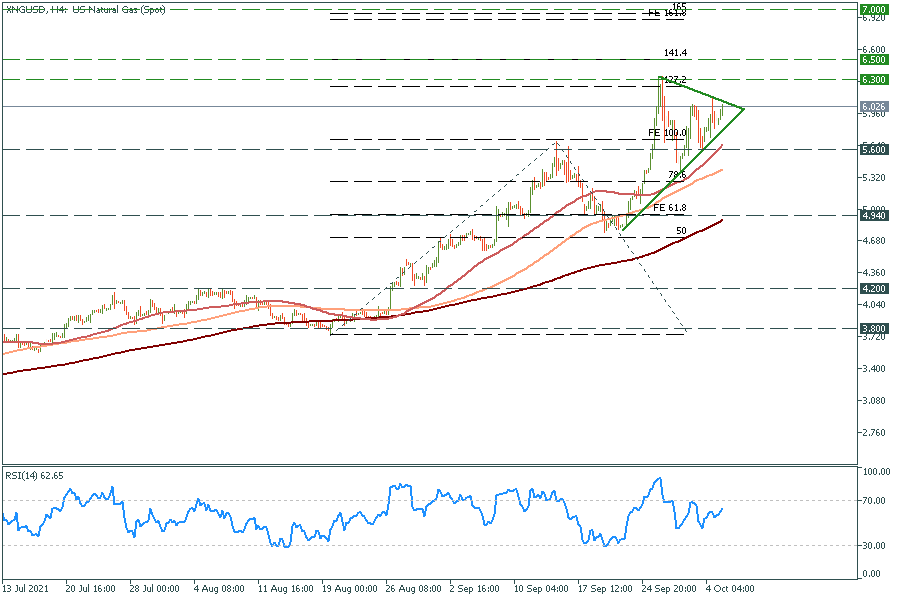
As for the chart, US natural gas is several days away from volatility increase. For now, the price is consolidating in a triangle and the breakout will decide its fate. In case of further growth, it is highly likely for the RSI divergence to form. That would be a sign of a pullback.
XNG/USD H4 chart
Support: 5.60; 4.94; 4.20
Resistance: 6.30; 6.50; 7.00
To trade natural gas, we need a trading strategy. And to have one we need to better understand the asset. Here are some tips for traders that will surely help you.
- Look through short-term energy outlook articles on our site to be in touch with the latest trends.
- To calculate your risks, it’s wise to check contract specifications for energy futures.
- Analyze related assets, like Brent and Crude oil. The price tends to correlate between them.
- Use technical analysis and define the support and resistance levels for the price.
If to perform trade analysis via technical indicators, the best for gas right now is RSI, because it can show you the divergences between the indicator and the price and spot possible reversal earlier, than others.
No growth is everlasting, and though the gas price has been skyrocketing for the last weeks, most of the time it lacks the volatility. So when this “Gas season” will be over, consider looking at the cryptocurrency, because it’s much more volatile. Also, 24\7 crypto trading means that you don’t need to wait for the market opening, just open your FBS Trading Platform or Meta Trader and enjoy the possibilities of a crypto trading account.
Now you know how to trade natural gas, so what are you waiting for?
Reference: FBS (05.10.2021) Gas lights up. FBS analytic news.
-
08-10-2021, 01:40 AM #36Senior Investor
- Join Date
- Apr 2018
- Posts
- 509
- Feedback Score
- 0
- Thanks
- 0
- Thanked 0 Times in 0 Posts
What affects oil price?
Oil is one of the most important assets, which presents the whole economic situation in the world. Just like the prices of most assets, oil price depends on the demand-to-supply ratio. During periods of economic growth, countries increase demand which leads to price gains. On the contrary, when the economy enters a regression phase demand drops and price follows it.
How to trade crude oil online?
There are two ways of trading crude oil online. You can trade contracts for difference (CFDs) or futures. While CFDs display the price in real-time, futures predict a future price change. Futures are the most volatile and risky instruments as they can be manipulated by traders with high capital. During March 2020 collapse Brent futures have been trading under the $0 level, while CDFs only reached $17. That is why we believe that trading contracts for difference is less risky.
You can trade oil and energies contracts for difference with FBS. Learn the contract's specifications and pick the best option for your trading strategy!
When is the best time to trade oil?
Oil price is influenced by the Organization of the Petroleum Exporting Countries, that is why the meetings and statements of this organization make a huge impact on an oil price movement. Their statements raise oil price volatility, but moreover, they define the future trend. That is why the best option for trading oil is to wait until one of this OPEC’s meetings or statements and follow the trend.
Another highly important data, which usually influences the price, is the US crude oil inventories data as the United States is the largest exporter of crude oil. Bigger reserves mean that the oil consumption stays under pressure, which is the first sign of upcoming economic stagnation. On the other hand, lower-than-expected reserves data points traders to the fact that the consumption grew in the past and the necessary replenishment is needed. In this case, additional purchases will stimulate oil price increase.
OPEC+ said it had “reconfirmed the production adjustment plan”, which referred to its previously agreed decision to add 400,000 barrels per day to the market for November. The recovery in global oil demand from the coronavirus pandemic has been quicker than many expected, while global supply has been disrupted by hurricane outages and low investment. As long as these two factors remain unchanged oil will gain constantly.
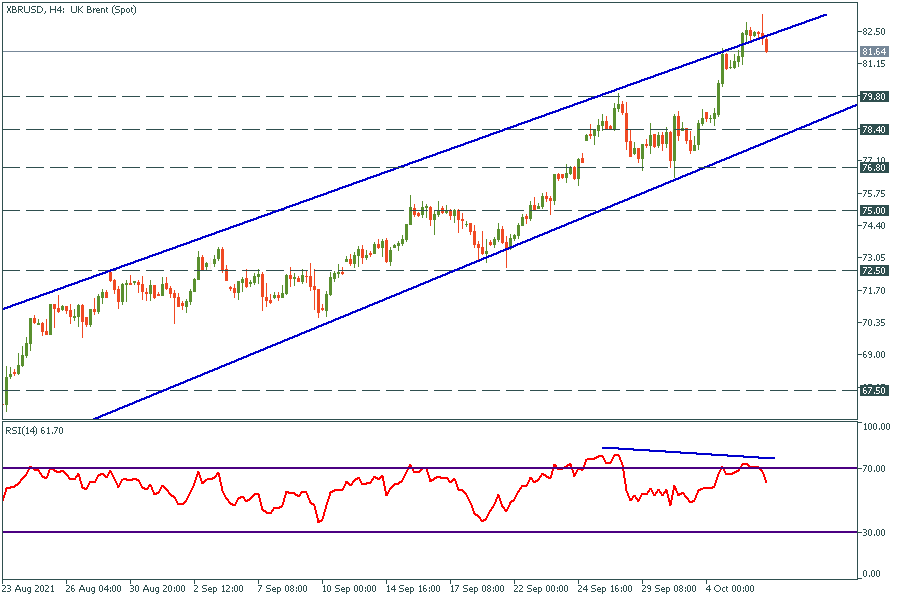
Brent's price is moving in the rising channel. The bearish divergence occurred on the RSI chart, that is why expect a tiny correction to the $79.8 support level. After that, the price might reverse and head towards $86.3, where the 2018 high locates. To break this level buyers need to get some strong news, which will act as a buy signal. Without them, the price will get rejected from the $86.3 level and solid correction will happen.
Reference: FBS (06.10.2021) How to trade oil. FBS analytic news.
-
11-10-2021, 03:45 PM #37Senior Investor
- Join Date
- Apr 2018
- Posts
- 509
- Feedback Score
- 0
- Thanks
- 0
- Thanked 0 Times in 0 Posts
What is happening?
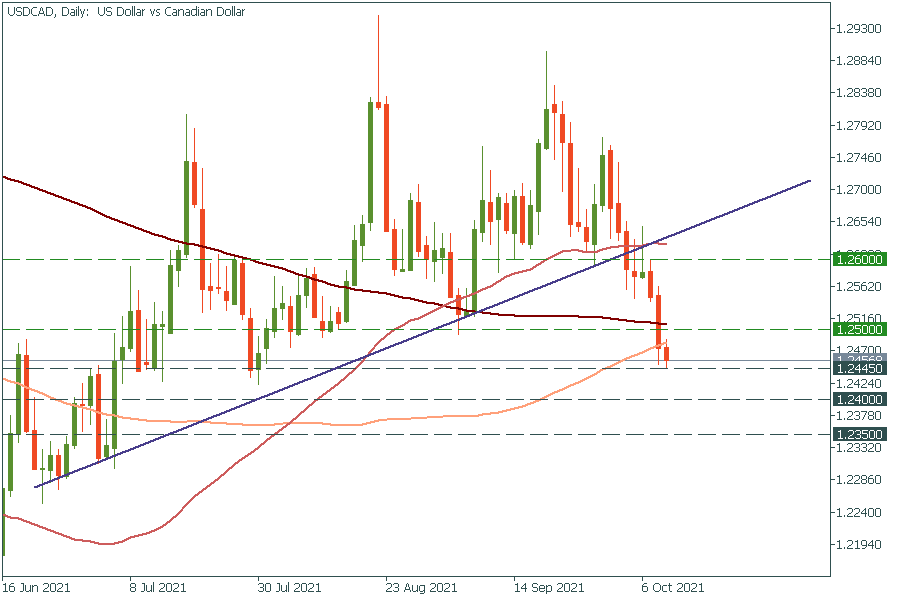
Just look at the charts above – the Canadian dollar has skyrocketed! Such strong growth has been caused by several reasons.
First, oil prices have gained from the global energy crunch. Crude oil has hit the highest level since 2014 as the demand is growing ahead of winter, while OPEC+ doesn’t rush to increase output significantly. Canada is one of the world’s largest oil producers and its currency has historically positively correlated with oil prices.
Second, Canadian employment figures came out better than analysts forecasted on Friday. It can signal another taper from the Bank of Canada later this month, which may push the CAD up. Just to remind you, the BOC was the first bank that tightened the policy after the Covid-19 crisis. Thus, it’s quite reasonable for the bank to continue tapering after a strong job report. Meanwhile, the US has revealed the worse-than-expected NFP numbers. Canadian Dollar strength and US Dollar weakness pressed USD/CAD to its lowest level since July.
Tech outlook
USD/CAD has broken through all the moving averages and the support line while moving down. It has stopped ahead of the support level of 1.2445 – the July lows which the pair has failed to cross and reversed up. Let’s wait for a breakout. If it occurs, the pair is likely to drop to the psychological level of 1.2400. However, before the breakout happens, we might see a pullback to the 200-day moving average of 1.2500.
Reference: FBS (11.10.2021) All is good for canadian Dollar. FBS analytic news.
-
18-10-2021, 03:56 PM #38Senior Investor
- Join Date
- Apr 2018
- Posts
- 509
- Feedback Score
- 0
- Thanks
- 0
- Thanked 0 Times in 0 Posts
The stocks of the vaccine producers have gained a lot during 2021 due to the wide vaccination campaign around the world. Still, the Covid-19 pandemic is still not over as the virus is mutating and the scientists need to create new and new vaccines. What does it mean for traders? A great opportunity to invest in pharma stocks especially the ones engaged in the production of vaccines.
Moderna
Moderna has joined the S&P 500 index this year. It skyrocketed to almost $500 – the all-time high on this news, but then dropped back to $300 amid the broad market correction. Moderna has recently submitted its COVID-19 booster shots for adults to the FDA. If officials approve it, the stock price of Moderna will rocket! The first resistance level lies at the round number of $350.00. If the stock manages to cross it, the stock may jump above the 50-day moving average at $400.00. Support levels are $295.00 and $250.00.
AstraZeneca
Many hedge funds have added AstraZeneca into their portfolios. Among them are Fisher Asset Management, GQG Partners, and other heavyweights. Apart from producing vaccines against Covid-19, the company produces other medicines and also working on an advanced breast cancer treatment. The key level of $8750 acts now as support, while it was acting like resistance during August. Thus, we might expect the price to retrace to this level and then reverse up to $9000. When AstraZeneca breaks above this level, it will rally up to $9250
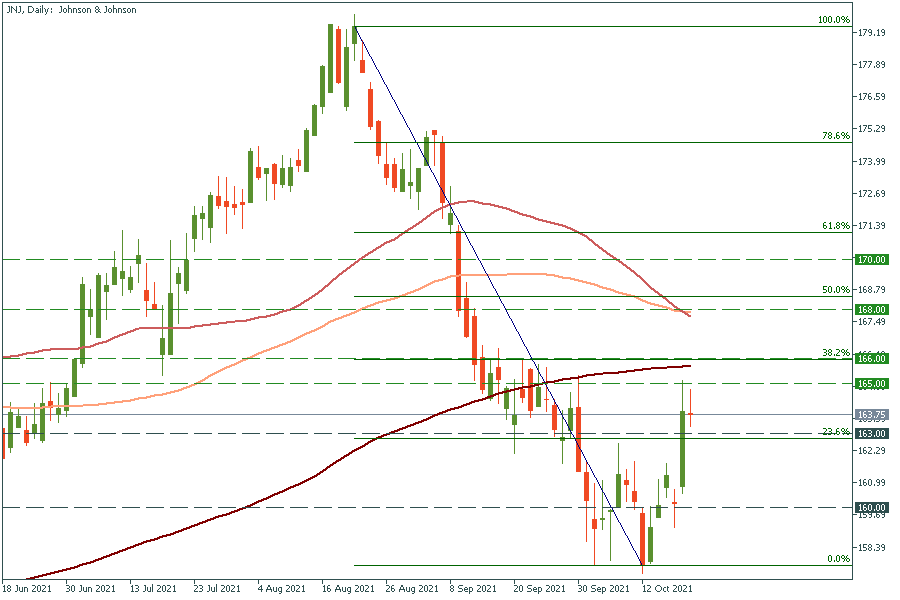
Johnson & Johnson
JNJ sells pharmaceuticals, consumer health products, and many well-known consumer goods (Johnson's Baby products, Acuvue contact lenses, etc). Apart from that, it’s a vaccine maker and quite a successful one! The FDA claimed that the second dose of the JNJ Covid -19 vaccine is effective two months after the first. As a result, the JNJ stock skyrocketed.
The stock of JNJ has failed to cross the psychological level of $160.00. If it manages to break it and the high of October 7 at $162.00, we might expect the downtrend to change to an uptrend. So far, the stock price is moving in the descending channel. Still, if we look at the weekly or monthly chart, we’ll see that it’s just a correction in the long-term uptrend. Thus, wait for the confirmation of the change of a trend.

Reference: FBS (15.10.2021) Top Pharma stocks to buy now
-
21-10-2021, 02:28 PM #39Senior Investor
- Join Date
- Apr 2018
- Posts
- 509
- Feedback Score
- 0
- Thanks
- 0
- Thanked 0 Times in 0 Posts
Netflix
Netflix published better-than-expected earnings results for the third quarter and also surprised investors with the huge subscriber growth due to the popular "Squid Game". Netflix added 4.38 million subscribers, while Wall Street analysts forecasted 3.86 million. Wow! However, the market reaction was mixed. Yesterday's session finished in a goalless draw: nor bears neither bulls took control. The candlestick closed with no shadow, which means the opening and closing prices were equal.
Why did Netflix drop on good results?
In short, ‘buy the rumor – sell the fact’. All investors knew that the “Squid Game” has astonishing popularity, that’s why they were expecting good results from the company and priced in the good outcome well ahead of the release. When the actual number was known, the stock fell.
On the daily chart, we can notice the bearish divergence, which means the stock price can fall in the short term. It may correct down to the 50-period moving average of $610, which should support the stock from falling further (it has done that several times before). Still, the long-term trend remains bullish.
Tesla
Tesla has reported better-than-expected earnings results for the third quarter. EPS: $1.86 vs the forecast of $1.52. Notably, the report marked the 9th quarter of profit in a row. Earlier, Tesla announced it delivered 241,300 electric vehicles globally in the third quarter, which was Tesla’s record number for quarterly deliveries.
The Tesla stock tends to rally (look at the long green candles at the chart below) ahead of the earnings releases but then drops when the actual numbers are known. Thus, today, the stock can fall in the short term. However, it is going to gain from such good results in the long term as it showed investors that it is doing its business great.
Tesla was rallying so rapidly as it even broke the upper line of the channel. Now it’s just below the resistance level of $880.00. If it manages to break it, it can rocket to the psychological mark of $900.00.
JNJ
The pharma giant Johnson & Johnson published earnings that beat analyst expectations, sending its price soaring (look at the long green candle in the chart). The Covid-19 remains the main threat, that’s why JNJ is likely to gain in the 4th quarter due to its vaccine. Besides, the Food and Drug Administration authorized Covid-19 vaccine booster shots made by Johnson & Johnson, which is really great for Johnson & Johnson.
The stock price of JNJ has failed to cross the resistance zone of $165.00-166.00 (the 200-day MA and the 38.2% Fibo level). If it manages to cross it, the way up to the 50- and 100-day MAs at $168.00 will be open. Support levels are $163.00 (the 23.6% Fibo level) and $160.00.
Reference: FBS (21.10.2021) Earning overview. Tesla, Netflix, IBMS. JNJ.
-
01-11-2021, 03:58 PM #40Senior Investor
- Join Date
- Apr 2018
- Posts
- 509
- Feedback Score
- 0
- Thanks
- 0
- Thanked 0 Times in 0 Posts
What will happen?
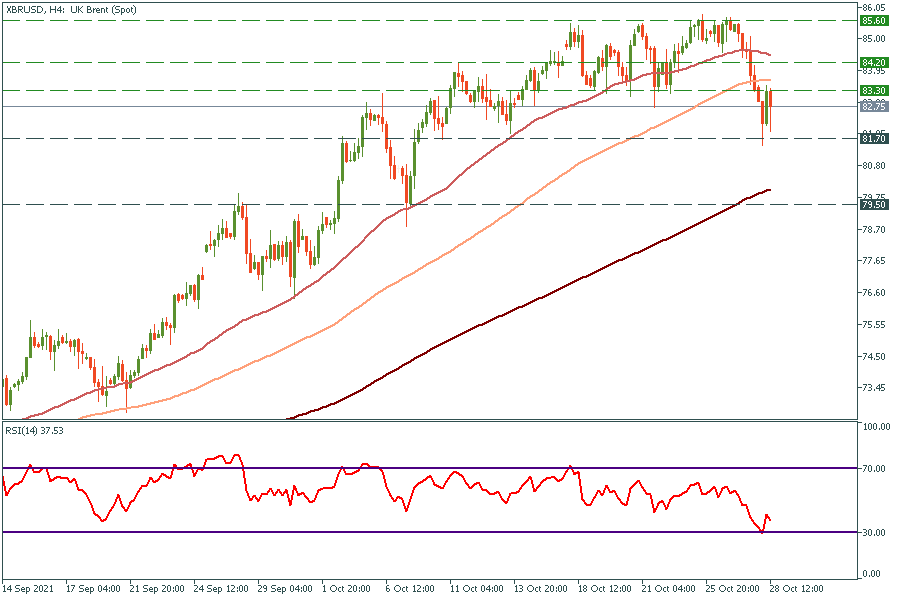
Brent's price fell after a less than expected oil crude inventories report. Usually, the less expected report pushes the price higher, but this time everything went the opposite way.
It might be the signal of investors’ growing concerns about the OPEC+ upcoming conference, where oil global supply might be increased. Earlier, the CEO of Saudi Aramco called for a supply increase, since global oil inventories decrease too fast. From his point of view, if OPEC+ will not change its policy, it might lead to the continuation of the global energy crisis. In this case, XBR/USD will explode and reach $100 shortly.
}On the 4H chart, Brent fell under the 100-period moving average. At the moment it is consolidating between $81.7 and $83.3. Locally, it looks oversold according to the RSI, that’s why we can see a pullback up to $84.2 first. The main resistance will be the 50-period moving average, which has been holding the price since the middle of September 2021. If XBR/USD breaks through this resistance, it might rise as high as $85,6 again. Otherwise, if it gets rejected, it will be another proof of a downtrend beginning. The main targets for the down movement are $81.7 and $79.5.
the situation which happens in 2018 repeats. The price drew 3 highs with the RSI divergence just as it did in the previous time. Later, after that pattern appeared, the price has been falling for 7 weeks straight. OPEC+ conference on August 4 will answer the question: “can technical analysis predict the future?”
Reference: FBS (28.10.2021) Brent: OPEC+ Might Intervene. FBS Analitycs
-
Sponsored Links


 Reply With Quote
Thread Information
Users Browsing this Thread
There are currently 1 users browsing this thread. (0 members and 1 guests)
Tags for this Thread
 Posting Permissions
24 Hour Gold

Advertising
- Over 20.000 UNIQUE Daily!
- Get Maximum Exposure For Your Site!
- Get QUALITY Converting Traffic!
- Advertise Here Today!
Out Of Billions Of Website's Online.
Members Are Online From.
- Get Maximum Exposure For Your Site!
- Get QUALITY Converting Traffic!
- Advertise Here Today!
Out Of Billions Of Website's Online.
Members Are Online From.


