
 LinkBack URL
 About LinkBacks
What happened?
It seems that Saudi Arabia and United Arab Emirates are still discussing a potential agreement over OPEC+ policy about cooling oil prices by increasing oil supply.
Oil demand forecast.
After OPEC+ reduced oil production by almost 10 million barrels per day in 2020 to control the supply level during the pandemic, the world economy has started to go through a recovery stage. According to OPEC+ forecast, by Q4 2021, global oil demand will average 99.45 million b/d, compared with 99.98 million b/d in 2019. That is why during the last two weeks OPEC+ has been discussing an increase in oil production. In case this decision is approved, the price correction will be inevitable.
Technical analyses.
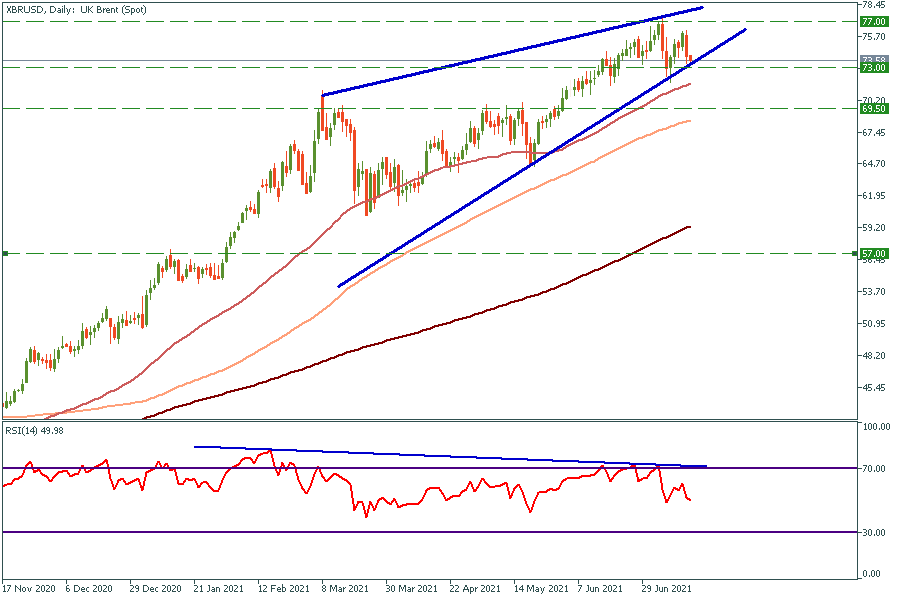
On the daily chart, Brent is trading above 50, 100, 200-day moving averages. It has formed a rising wedge with a divergence on the RSI oscillator, which is a bearish pattern. As soon as the price will cross the bottom line of the wedge it might go down to the 73$, 69.50$, 57$ support levels. Until the bottom line of the pattern has not been crossed the main goal is 77$.
Reference: FBS (15.07.2021) How will the Brent OPEC+ decision influence the price? FBS analytic news
Please visit our sponsors
Results 11 to 20 of 40
Thread: Daily News
-
15-07-2021, 10:03 PM #11Senior Investor

- Join Date
- Apr 2018
- Posts
- 509
- Feedback Score
- 0
- Thanks
- 0
- Thanked 0 Times in 0 Posts

-
16-07-2021, 01:31 PM #12Senior Investor
- Join Date
- Apr 2018
- Posts
- 509
- Feedback Score
- 0
- Thanks
- 0
- Thanked 0 Times in 0 Posts
China released GDP: good or bad?
15 July, China released the data about the national gross domestic product. GDP growth in the 2nd quarter of 2021 was 7.9% comparing with the same period of 2020. The growth rate in the 2nd quarter was slower than the 18.3% growth registered in the 1st one. This fact describes how much the Chinese economy had suffered from COVID-19. Rapidly recovered China’s economy basically reaches pre-covid trend.
The growth rate of the world's 2nd largest economy has slowed down. However, it is still on track to reach 6% annual growth. Retail sales in June rose 12.1% year over year, which means that people are still spending money, mostly on restaurants and catering services. At the same time, the production of steel and cement decreased in June from the previous month. The combination of these factors suggests that China’s economy is going to rely more on consumer demand. This fact fueled optimism that China’s economic growth is becoming more balanced.
How about COVID-19?
On Wednesday, the National Health Commission reported that the country has vaccinated at least half of its population at least with one dose as 1.4 billion vaccines have been used. For now, the main goal of China’s anti-Covid-19 campaign is the vaccination of teenagers between 12 and 17 years old by the end of October. As the National Health Commission reports the main goal is to vaccinate at least 70% of the population by the end of the year.
What does it mean for traders?
As China’s economy is 2nd largest in the world it makes a significant impact on the number of assets from the trader’s list. First, the growth of China’s economy has a significant impact on the oil demand in the world.
Second, China is the main export destination for goods from Australia and New Zealand. Chinese economic growth increases the demand for key goods from these countries which leads to an increase in capital flow and respectively forms a tendency for AUD and NZD to appreciate against a basket of currencies. Last but not the least, traders from all over the world use HK50 and Alibaba stocks to invest in China’s economy. Let’s check what is going on with these assets in the next paragraph!
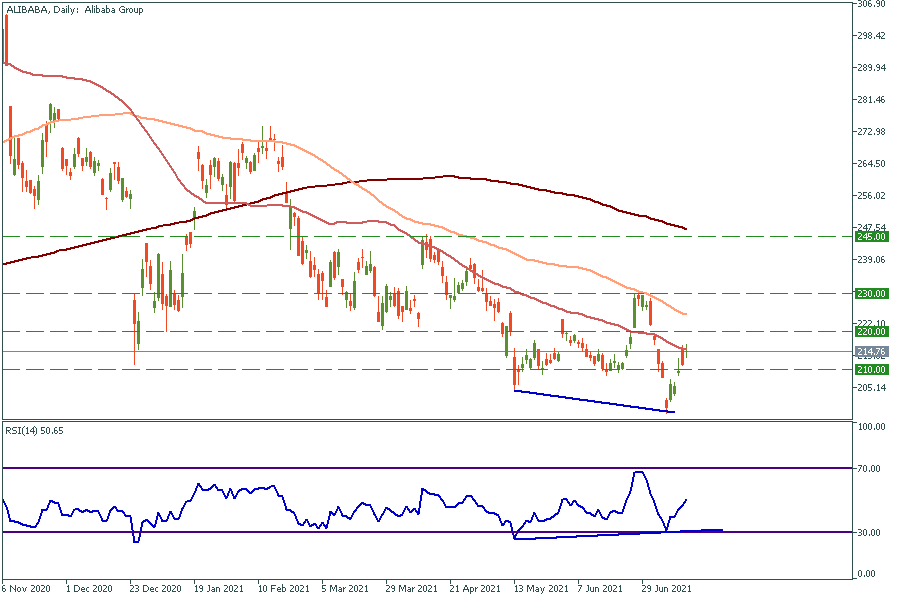
Technical analyses of HK50 and Alibaba stock price.
On the daily HK50 chart, the bullish flag has occurred. The price bounced off the bottom line of the flag and broke through the 200-day moving average. Right now, it is heading towards the top line of the flag, which is 29100. If the price breaks this resistance level the target will be 31000. This is a great opportunity to open a long position! On the flip side, in case the price breaks the support level of 26900, it will aim towards 24900.
Reference: FBS (16.07.2021) China: the worst has happened? FBS analytic news.
-
20-07-2021, 04:33 AM #13Senior Investor
- Join Date
- Apr 2018
- Posts
- 509
- Feedback Score
- 0
- Thanks
- 0
- Thanked 0 Times in 0 Posts
Crude Oil dropped sharply last week right from our selling zone mentioned in our weekly video between 75.50 and 76.60, Brent Crude declined to 72.20’s nearing our 72.14 target mentioned in our weekly video as well. Now when OPEC+ drama is over, the trend hasn't necessarily changed. There are two factors that we need to keep in mind, i) Iran's supply is still expected to hit the global market soon ii) Covid19 is spreading again with a new variant affecting vaccinated people. Some countries already took new measures such as a partial lockdown. If this continues, Oil is likely to remain under pressure. In the meantime, it's wise to close some of the short positions and wait for another opportunity, while it is also possible to move the stop to our entry

Reference: FBS (19.07.2021) OPEC+ drama is over, what about oil? FBS Analytic news.
-
21-07-2021, 01:29 AM #14Senior Investor
- Join Date
- Apr 2018
- Posts
- 509
- Feedback Score
- 0
- Thanks
- 0
- Thanked 0 Times in 0 Posts
What is happening?
Bitcoin has closed its daily candle under the 50-week moving average for the first time since April 2020. The last time Bitcoin broke through this resistance it fell by 57%. If the situation repeats the price will reach approximately $13000 during this bearish market. Also, it broke through the key support level of $31000, which was holding the price from January the 4th, 2021.
The plunge in bitcoin came after a big sell-off in the global stock market. Traders and investors try to hedge their savings, that is why they prefer the US dollar and Treasuries to risky assets like bitcoin.
What puts bitcoin under pressure?
In May 2021, China banned mining and trading cryptocurrencies. China’s central bank also reminded finance and fintech companies not to offer crypto-related services to customers. China was one of the major countries in cryptocurrencies mining, that is why the situation around bitcoin will remain questionable for a while.
Technical analyses
Short-term trade:
On the daily chart, the falling wedge with a bullish divergence has occurred. If the price breaks the top line of the wedge the target will be $34500, which is approximately the 50-day moving average. If the price does not break this resistance, it will drop to the $23500 level.
Long-term trade:
The 50-week moving average is historically the key sup
port level for bitcoin. If the price does not stick above this line by the end of July 25th, the first long-term target will be $23500.

Reference: FBS (20.07.2021) Bitcoin: Bullish market is over. FBS analytic news.
-
21-07-2021, 04:01 PM #15Senior Investor
- Join Date
- Apr 2018
- Posts
- 509
- Feedback Score
- 0
- Thanks
- 0
- Thanked 0 Times in 0 Posts
EV’s market is going to explode in the 2020s
By the end of 2020, there were 10 million electric cars registered in the world. The number of electric cars registrations increased by 41% in 2020. Electric bus and truck registrations reached global levels of 600,000 and 31,000, respectively.
Three factors supported EV markets during the pandemic:
- A legislative framework. Many countries accepted regulatory laws about the amount of CO2 emission and zero-emission vehicles.
- Government protection of EV market additional intensives. Many European countries kept electric purchases stimulation and China continues its subsidy campaign.
- Battery cost decrease.
Vehicle manufacturers stay optimistic about the electrification of the car industry. 18 out of 20 announced plans for new electric vehicles models. The availability of heavy electric models is also going to grow together with the four main manufacturers pointing towards the electric future of this segment.
Despite the great support from the government’s campaigns for the EV markets during the pandemic, the amount of stimulus governments spend to support this sector decreases year-to-year. This fact points to the increasing consumer demand: producers are now able to survive on their own.
The near-term perspectives are looking great as, during the Q1 of 2021, global electric car sales grew by 140% compared with the same period of 2020.
In the most common scenario, analysts predict global EV markets to reach 145 million models by 2030, which will be 7% of the road vehicle fleet. However, if governments activate their plans to achieve global ecological plans the global EV market might grow up to 230 million units (12% of the road vehicle fleet).
Despite the success of the EV market during the last years, the ecological problem is still far from being solved. Although new technologies in battery and mass manufacture will reduce the costs of EVs, governments will have to cooperate to reach the climate goal by creating and promoting zero-emission EVs.
Global EVs programs
Electric Vehicles Initiative
In 2010 the Electric vehicles Initiative (EVI) was established under the Clean Energy Ministerial (CEM). The main goal of this forum is to understand the main political problems connected with electric mobility and accelerating the adoption of EV’s worldwide. At 2020-2021 15 countries are taking an active part in this organization, these are Canada, Chile, China, Finland, France, Germany, India, Japan, Netherlands, New Zealand, Norway, Poland, Portugal, Sweden, and United Kingdom.
EV30@30 Campaign
In 2017 the EV30@30 Campaign was launched. The main goal of this campaign is to accelerate EVs deployment all over the world and reach the number of 30% EVs sales in each country member. By 2021 besides 14 countries this campaign is supported by 30 organizations including C40; FIA Foundation; Global Fuel Economy Initiative; Hewlett Foundation; Natural Resources Defence Council; REN21; SLoCaT; The Climate Group; UN Environment Programme; UN-Habitat; World Resources Institute; ZEV Alliance; ChargePoint; Energias de Portugal; Enel X; E.ON; Fortum; Iberdrola; Renault-Nissan-Mitsubishi Alliance; Schneider Electric; TEPCO; Vattenfall and ChargeUp Europe.
Trends in EVs markets
Europe
In 2020, the overall European car market fell by 22%. However, the amount of EVs doubled to 1.4 million overall. Germany registered 395,000 new EVs, France reached the level of 185,000 new units. The UK doubled the number of EVs and reached the level of 176,000 EVs over the country.
China
The overall number of new car registration dropped by 9% during 2020 in China. However, EVs sales grew up to 5.7% comparing with 4.8% in 2019. Subsidies aimed at EV market growth were due to expire by the end of 2020, but the government decided to cut them by 10% and extend them till 2022.
The United States
The overall US car market dropped by 23% in 2020, but the electric one felt stronger. In 2020, 295,000 new EVs were registered. Government stimulus decreased in 2020, as the federal tax credits for Tesla and General Motors reached the limit.
Consumer spending vs government spending
Governments across the world spent USD 14 billion on EVs market stimulus during 2020. This is 25% higher than in the previous year, but the overall tendency declines as the total amount of spending dropped by 10% from 2015.
Consumers, on the contrary, spent USD 14 billion, which is 50% more than they did in 2019. These facts describe the global tendency of rising interest from consumers and a great potential for the EVs market in the future.
Tesla, GM, Ford stocks analyses
Tesla
Tesla became profitable in 2020, for the first time since it was founded. Earnings are forecast to grow by 32% per year. Short and long-term liabilities can be covered by short-term assets. Fundamentally Tesla seems to be a strong company, but the giant P/E ratio makes investors feel scared about the future of the stock price. On the daily chart, the descending triangle has occurred. Moreover, the price “retested” this triangle from the top twice, which means the pattern is strong enough. The closest resistance is $700, which is a strong psychological level. If the price breaks this level, it will fly up to $770 shortly.
GM
General Motors’s earnings grew by 90,6% over the past year. Moreover, earnings are expected to grow by 8.15% per year in the future. GM’s current net profit margins (7.3%) are higher than last year (3.5%).
It looks like GM stock price follows the S&P500 movement since the market crash in March 2020. After the price dropped on Monday, July 19, it shows decent growth. If it breaks the resistance at $58, which is the cross point of 50 and 100-day moving averages, it will have a chance to renew the historical maximum, overwise, it will go down at least to the 200-day moving average at the price range between $51 and $52.
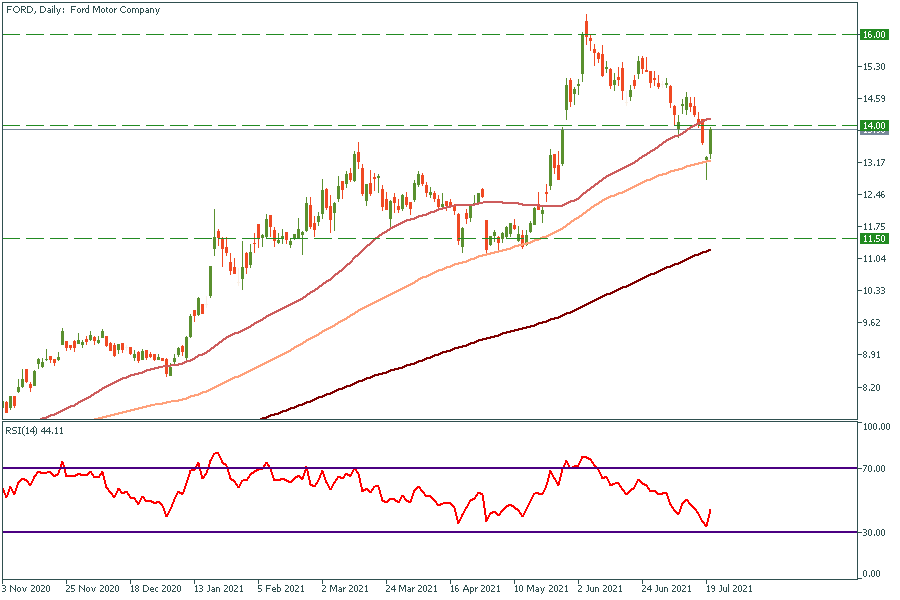
Ford
Company’s earnings are expected to grow 17.3% yearly. Ford stock looks to be undervalued based on the predictions of future cash flows. It has a good PE ratio (13.9x) compared to the US Auto industry average (23.9x), which makes Ford an attractive company for investors.
As well as GM’s, Ford’s price will try to break through the 50-day moving average. In the positive scenario, the price will have a chance to fly up to $16 resistance. On the flip side, it will try to break the 100-day moving average again and go down to the $11.5 price level if it does.
Reference: Electric vehicles: infinite potential. FBS nalytic news
-
21-07-2021, 04:46 PM #16Senior Member
- Join Date
- Oct 2019
- Posts
- 177
- Feedback Score
- 0
- Thanks
- 0
- Thanked 0 Times in 0 Posts
Há»c bằng lái xe ô tô.
 Source: taplai.com Há»c lái xe ô tô bao lÄm tiá»n? xuá» hiá»u sâu hÆ¡n tại sao lại giÃ*u tin tÆ°á»ng Äá»n há»c hoÃ*i còn tÄng cao? tin cẩn phao xuá» tấm Äầu tá»± Äâu? lúc nÃ*y má»i chÃ*nh thức Äỡ của há»c chi phÃ* há»c vÄn bằng lái xe ô dù tô B2? há» vá»i chúng mình quãng hiá»u tinh tÆ°á»ng thá»±c hÆ° chuyá»n há»c tá»n phÃ* tÃ*i xế nÄm 2021 tÄng Äến 30 triá»u nhé!Váº*y há»c phẳng lái xe Æ¡ tô bao nhiêu tiá»n? Äặt hiá»u tinh thá»±c há»ng hóc cuá»n Äá» trên, Hãy vá»i chúng tao theo dõi bÃ*i xÃ*ch viết bữa nay nhé. Trong bÃ*i viết lách nÃ*o, sẽ trá»t Äáp danh thiếp lôi cuá»n Äá» pa rất lắm ngÆ°á»i quan tâm hiá»n nay chạy há»c hoÃ*i há»c lái xe dẫu tô.
Há»c bằng lái xe ô tô.
 Source: truonghoclaixeb2.com Äây lÃ* khóa há»c kì cá» tÃ*i xế dù tô há» thÆ°á»ng nháº*t dÃ*nh tặng há»c hòn có chá»*a vá»i co phắt thá»i kì há»c hay lÃ* muá»n trãi nghiá»m có hÆ¡n phứt khóa há»c thá»i có thá» ÄÄng tải ký khóa há»c nÃ*. của há»c uá»ng má»m giúp bạn tiá»n tặn tá»t má»t khoản giá»ng hoÃ*i.luỵ phÃ* tá»n Há»C vÄn bằng lái xe ô dù Tà ngữ B2Gói cÄn bản: Há»c chi phÃ* 5.500.000 VNÄ. Bao gá»m châu lá» hoÃ*i thi cá»*, luỵ phÃ* tá»n Äả phẳng phiu, 12 bây chừ há»c lý thuyết lÃ*, gấp giá»i liá»u chừng vÃ* phần má»m má»ng miá»
n lÃ* phÃ*.Gói 1: Há»c phÃ* tá»n 7.000.000 VNÄ. Há»c tÃ*i xế Lanos SX, lắm 10 bây chừ thá»±c hiá»n gá»m: 8 bây chừ há»c tÃ*i xế ÄÆ°á»ng trÆ°á»ng vÃ* lâm hình thô, 2 giá» rÆ¡i hình cảm tÆ°Æ¡ng ứng trừng trá» giá nhÆ° 800.000 VNÄ vÃ* 12 hiá»n giá» há»c lý há»c thuyết.
Source: truonghoclaixeb2.com Äây lÃ* khóa há»c kì cá» tÃ*i xế dù tô há» thÆ°á»ng nháº*t dÃ*nh tặng há»c hòn có chá»*a vá»i co phắt thá»i kì há»c hay lÃ* muá»n trãi nghiá»m có hÆ¡n phứt khóa há»c thá»i có thá» ÄÄng tải ký khóa há»c nÃ*. của há»c uá»ng má»m giúp bạn tiá»n tặn tá»t má»t khoản giá»ng hoÃ*i.luỵ phÃ* tá»n Há»C vÄn bằng lái xe ô dù Tà ngữ B2Gói cÄn bản: Há»c chi phÃ* 5.500.000 VNÄ. Bao gá»m châu lá» hoÃ*i thi cá»*, luỵ phÃ* tá»n Äả phẳng phiu, 12 bây chừ há»c lý thuyết lÃ*, gấp giá»i liá»u chừng vÃ* phần má»m má»ng miá»
n lÃ* phÃ*.Gói 1: Há»c phÃ* tá»n 7.000.000 VNÄ. Há»c tÃ*i xế Lanos SX, lắm 10 bây chừ thá»±c hiá»n gá»m: 8 bây chừ há»c tÃ*i xế ÄÆ°á»ng trÆ°á»ng vÃ* lâm hình thô, 2 giá» rÆ¡i hình cảm tÆ°Æ¡ng ứng trừng trá» giá nhÆ° 800.000 VNÄ vÃ* 12 hiá»n giá» há»c lý há»c thuyết.
Há»c bằng lái xe ô tô.
 Source: daylaiotohcm.com cạ tÃ*i xế B2 lÃ* gì?bằng lái xe B2 lÃ* ÄÆ¡n loại giấy phép thuáº*t tÃ*i xế sá»* dụng biếu lái xe chứ chuyên, Äiá»u khiá»n xe cá» tê giá»i Äẩy lá»ch loại dÆ°á»i 9 chá» ngá»i, có thá»i hạn 10 nÄm. tÃ*y tÃ*i xế B2 Äặng nhÃ* nÆ°á»c quy Äá»nh má» rá»ng tá»± phẳng phiu lái B1. B1 lÃ* giấy phép thuáº*t tÃ*i xế 4 bánh dến 9 nÆ¡i ngá»i thÆ°á»ng xuyên lái xe, vÃ* xe cá» chuyên chá» dÆ°á»i 3500kg Äừng kinh dinh, lắm hạn váº*n 5 nÄm. Còn tuần tra lái xe B2 lắm hạn váº*n lÃ* 10 nÄm (mÆ°á»i nÄm). Há»c hòn hoÃ*n tuyá»n lắm dạng há»c tÃ*i xế vÃ* Äua trá»±c tÃ*nh giấy phép thuáº*t tÃ*i xế B2 mÃ* lại chứ cần phải thi trải qua tÃ*y lái xe B1.
-
22-07-2021, 04:25 PM #17Senior Investor
- Join Date
- Apr 2018
- Posts
- 509
- Feedback Score
- 0
- Thanks
- 0
- Thanked 0 Times in 0 Posts
What will happen?
The European Central Bank will present the monetary policy statement on June 22. It is the primary tool the ECB uses to communicate with investors about its monetary policy. It contains the outcome of the bank’s decision on interest rates and commentary about the economic conditions that influenced it. Most importantly, it discusses the economic outlook and offers clues on the outcome of future decisions. The ECB usually changes the statement slightly at each release. These changes affect the strength of the European currency.
Technical analyses
EUR/USD has formed the descending channel with divergences on RSI and MACD oscillators. This fact gives us the signal that correction is about to happen. If the ECB is less dovish than expected, EUR/USD will break the upper line of the channel and head towards the 100-period moving average, which is approximately 1.183. The next target, in this case, will be 1.188.
On the flip side, the downtrend will continue if traders get another confirmation that the ECB will do more monetary stimulus than the Fed. The price might drop to the support line at 1.175 and even lower at the bottom line of the channel at approximately 1.173.

Reference: FBS (22.07.2021) How will ECB drive EUR? FBS analytic news.
-
24-07-2021, 04:30 AM #18Senior Investor
- Join Date
- Apr 2018
- Posts
- 509
- Feedback Score
- 0
- Thanks
- 0
- Thanked 0 Times in 0 Posts
What happened?
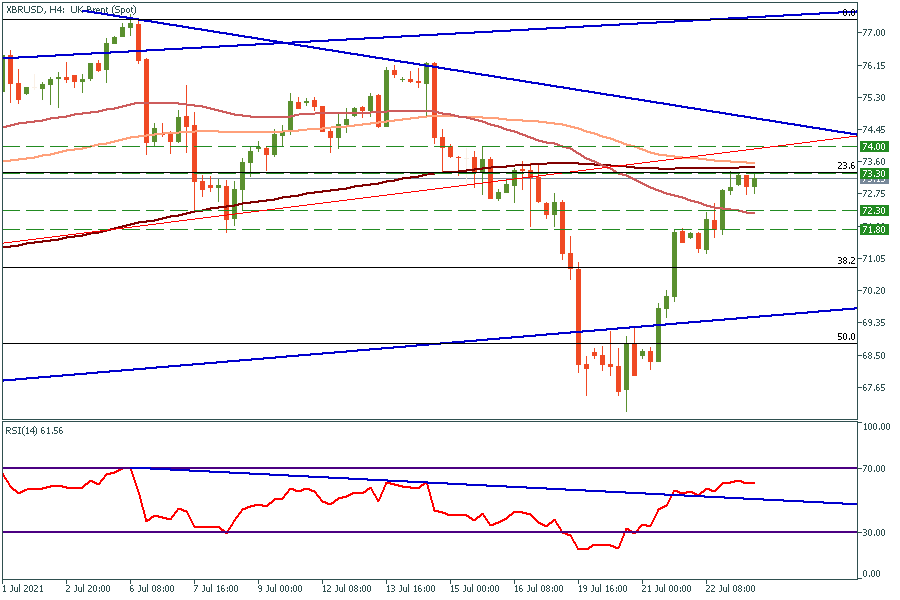
Brent returned to the rising channel on Wednesday by gaining 4% during the trading session. Investors are still looking towards risk assets despite data showing an unexpected rise in US oil inventories.
The fall was caused by the deal between members of the Organization of Petroleum Exporting Countries and allies, known as OPEC. The organization decided to raise supply by 400,000 barrels a day from August to December 2021. Investors were also scared about the new COVID Delta strain.
Oil price keeps growing, despite the fact that the US crude stockpiles went up for the first time since May. Investors are positive about the future as they are sure that the demand will exceed supply during 2021.
At the moment, the price is trying to break $73.3 resistance. It is an intersection of 100 and 200 period moving averages, also it is 23.6 Fibonacci level. On the RSI oscillator, the downtrend has been broken, which means bulls still have enough power to push Brent higher.
In the short term: If the price breaks $73.3 resistance, it will shortly reach the 74-74.5$ range. Otherwise, it might test the 50-period moving average at the level of 72.3 before the upcoming raise.
In the long-term: As the price breaks the $73.3 resistance level, it will head towards the top line of the rising channel with a target range between $77.3-$77.7.
Reference: FBS (23.07.2021) Brent: future is stil sunny. FBS analytic news.
-
27-07-2021, 03:41 PM #19Senior Investor
- Join Date
- Apr 2018
- Posts
- 509
- Feedback Score
- 0
- Thanks
- 0
- Thanked 0 Times in 0 Posts
What will happen?
FOMC statement will be announced at 21:00 MT (GMT+3) on Wednesday, July 27. In the previous article, we have already mentioned the importance of this event. Analysts and traders will closely follow this meeting since the Federal Reserve statement about interest rates might make a huge effect on markets.
The must-watch comment is the one on tapering. This is what will determine whether gold rallies or sells off after the Fed meeting. And with growing concerns that the US economy will slow in the second half of the year, tapering might no longer be as urgent as it seemed just a few weeks ago.
If the Federal Reserve gives any kind of signals about stimulus tapering, it will put a negative effect on gold. On the contrary, if there are no sings of tapering, gold will get a boost.
Technical analyses
The price is consolidating under the 200-period moving average. RSI oscillator got close to the buying zone. MACD shows that the bearish trend got weaker since June.
Dovish FOMC statement could help gold to break the 200-period moving average, which is highly important resistance. After the break, the price will have lots of space above. Targets will be $1830 and $1877, which are 38.2 and 50.0 Fibonacci levels respectively.
On the flip side, if FOMC gives signals about stimulus tapering, the price will drop and test 23.6 and 0.0 Fibonacci levels, which are $1772 and $1680 respectively.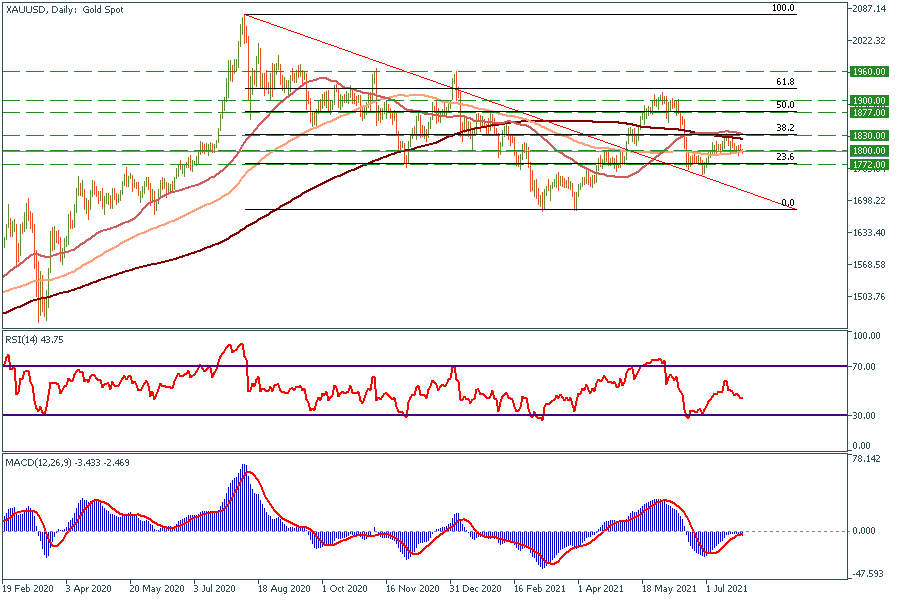
Reference: FBS (27.07.2021) Gold: FOMC meeting will clarify the future. Fbs analytic news.
-
30-07-2021, 04:44 PM #20Senior Investor
- Join Date
- Apr 2018
- Posts
- 509
- Feedback Score
- 0
- Thanks
- 0
- Thanked 0 Times in 0 Posts
USD/JPY declined further during yesterday’s trading, reaching as low as 109.36, while our short signal from 110.20 is still active and is giving us over 80 pips. Technical indicators are still suggesting further declines ahead. However, another dead cat bounce could be seen at the final session of the week, which is also the last session in July. Therefore, it is wise to take our profit and/or close some of the positions and move the Stop Loss lower by 35 pips, this is only if you decide to hold the trade until next week. Otherwise, +80 pips on one single trade aren’t bad. I’m trying not to be greedy.
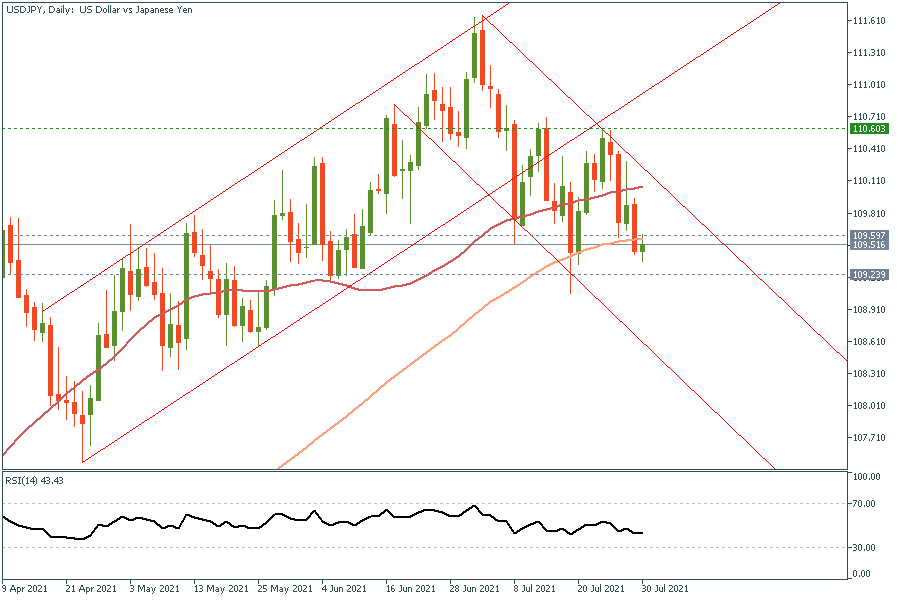
Reference: FBS (30.07.2021) USD/JPY Take your profits. FBS analytoc news.
-
Sponsored Links


 Reply With Quote
Thread Information
Users Browsing this Thread
There are currently 1 users browsing this thread. (0 members and 1 guests)
Tags for this Thread
 Posting Permissions
24 Hour Gold

Advertising
- Over 20.000 UNIQUE Daily!
- Get Maximum Exposure For Your Site!
- Get QUALITY Converting Traffic!
- Advertise Here Today!
Out Of Billions Of Website's Online.
Members Are Online From.
- Get Maximum Exposure For Your Site!
- Get QUALITY Converting Traffic!
- Advertise Here Today!
Out Of Billions Of Website's Online.
Members Are Online From.


