
 LinkBack URL
 About LinkBacks
Forecast for USD/JPY on September 18, 2020
USD/JPY
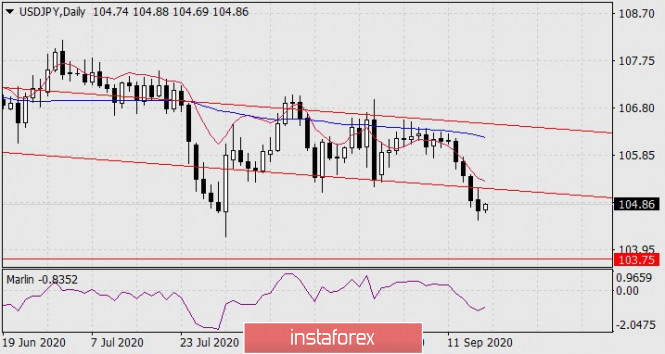
The USD/JPY pair retested the trend line from below and continued to decline on Thursday. The yen lost 21 points, but today there is a correction in the Asian session. The signal line of the Marlin oscillator is reversing to the upside, which indicates the price's intention to continue doing so until the evening or Monday. After the correction is completed, the price can fall to the previously indicated target of 103.75.
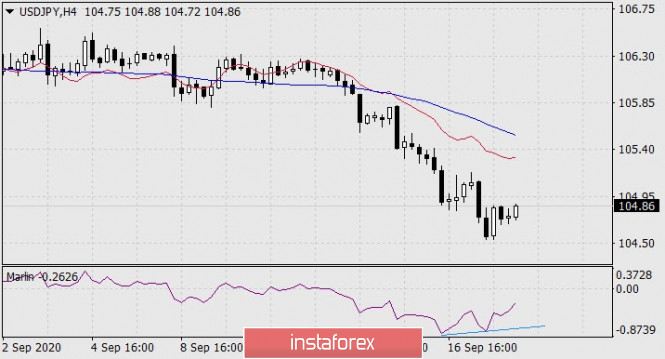
The price formed a short convergence with the Marlin oscillator on the four-hour chart, this is a sign of the upcoming sideways price movement. There will probably be no strong movements in the market until the beginning of next week.
Analysis are provided byInstaForex.
Please visit our sponsors
Results 3,101 to 3,110 of 4086
Thread: InstaForex Wave Analysis
-
18-09-2020, 04:45 AM #3101Senior Investor


- Join Date
- Aug 2012
- Posts
- 1,942
- Feedback Score
- 0
- Thanks
- 0
- Thanked 0 Times in 0 Posts

-
21-09-2020, 06:03 AM #3102Senior Investor
- Join Date
- Aug 2012
- Posts
- 1,942
- Feedback Score
- 0
- Thanks
- 0
- Thanked 0 Times in 0 Posts
Forecast for AUD/USD on September 21, 2020
AUD/USD
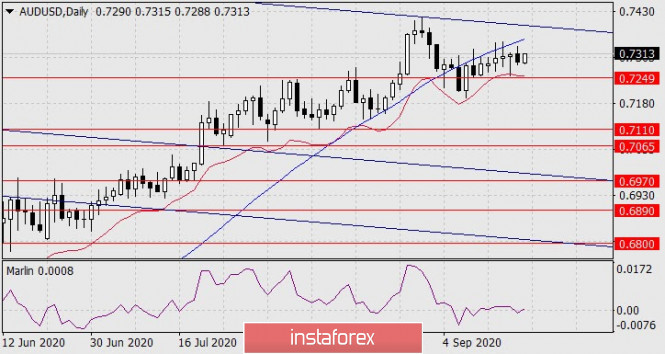
The dollar index strengthened by 0.10% on Friday, it was enough for the overbought Australian to fall by 22 points (-0.30%). The signal line of the Marlin oscillator has sharply turned down and penetrated the zone of negative values, although it is trying to go back up at the moment. We assume this is the effect of price fluctuations. We expect the price to overcome the first target of 0.7249 (September 10 low) and continue to fall to the second target of 0.7110 (August 12 low).
The price fluctuates around the balance and MACD indicator lines on the four-hour chart. On the technical side, this means waiting for another impulse from the external market. The Marlin oscillator turned into a new wave of decline from the border of the growth area, which is a leading sign of a market reversal.
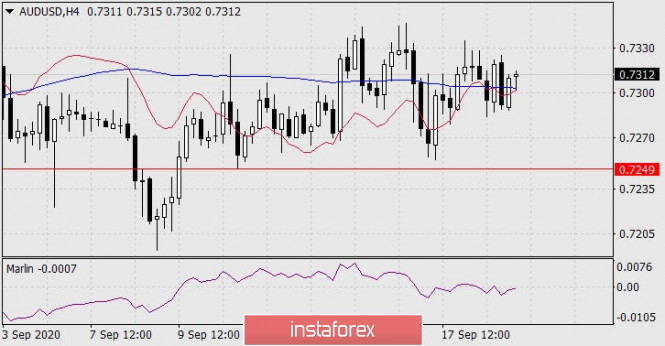
We are waiting for the technical signals to be confirmed. This will probably not happen until Tuesday.
Analysis are provided byInstaForex.
-
22-09-2020, 07:16 AM #3103Senior Investor
- Join Date
- Aug 2012
- Posts
- 1,942
- Feedback Score
- 0
- Thanks
- 0
- Thanked 0 Times in 0 Posts
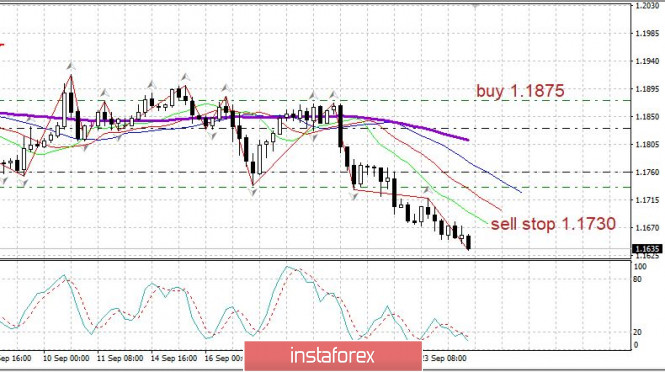
Forecast for EUR/USD on September 22, 2020
EUR/USD
There was a slight panic in the market on Monday. Due to the development of the second wave of coronavirus in Europe and the United States, investors began to fear the widespread closure of economies, as the UK intends to do from today. The maximum restrictions in England are introduced from the 28th. The British stock index FTSE 100 fell 3.38%. The European EuroStoxx 50 index lost 3.74%, while the US S&P 500 was down -1.16%. Investors started buying the dollar as a defensive currency and the euro fell 68 points.
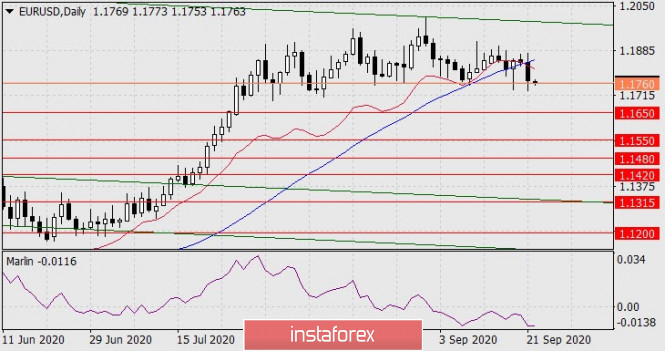
The price attacked the lower border of the two-month consolidation range at 1.1760, now it is ready to reach the nearest target at 1.1650. Then (after a local correction), we expect it to fall towards 1.1550.
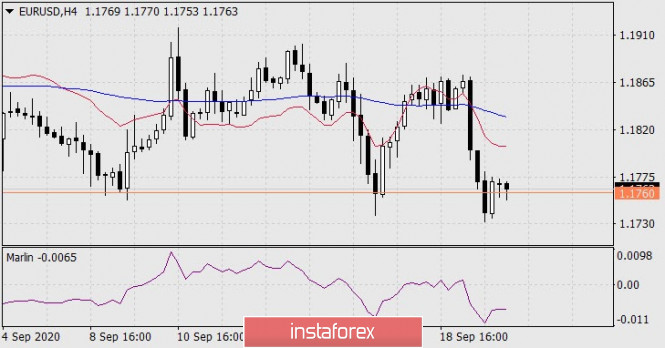
The decline occurs without reversal signals on the four-hour chart. We are waiting for the price to settle under 1.1760 and further progress towards the indicated targets.
Analysis are provided byInstaForex.
-
23-09-2020, 07:07 AM #3104Senior Investor
- Join Date
- Aug 2012
- Posts
- 1,942
- Feedback Score
- 0
- Thanks
- 0
- Thanked 0 Times in 0 Posts
Elliott wave analysis of EUR/JPY for September 23, 2020
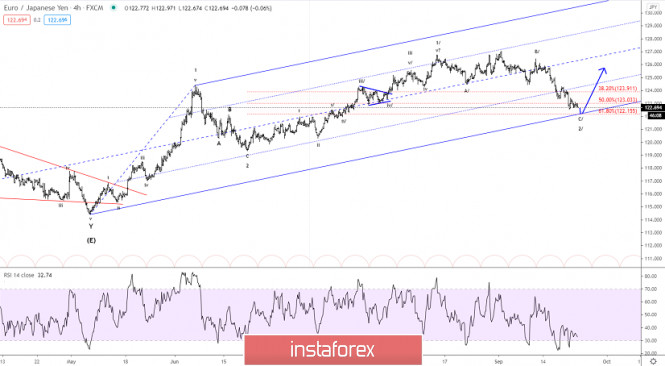
We are still expecting a final dip closer to our ideal target at 122.15 to complete wave 2/ and set the stage for a new impulsive rally in wave 3/ to above the former peak at 127.07. In the short-term, a minor triangle is developing as the penultimate wave and this should ultimate give away for the final dip to 122.15 to complete wave 2/.
Only a direct break above minor resistance at 123.42 wil indicate that wave 2/ already has completed while a break above resistance at 124.01 will confirm that wave 3/ is in motion.
R3: 124.40
R2: 124.01
R1: 123.66
Pivot: 123.30
S1: 122.87
S2: 122.53
S3: 122.15
Trading recommendation:
We are short EUR from 123.90 and we will buy+revers our short position to a long EUR-position at 123.25 or upon a break above 123.45
Analysis are provided byInstaForex.
-
24-09-2020, 07:39 AM #3105Senior Investor
- Join Date
- Aug 2012
- Posts
- 1,942
- Feedback Score
- 0
- Thanks
- 0
- Thanked 0 Times in 0 Posts
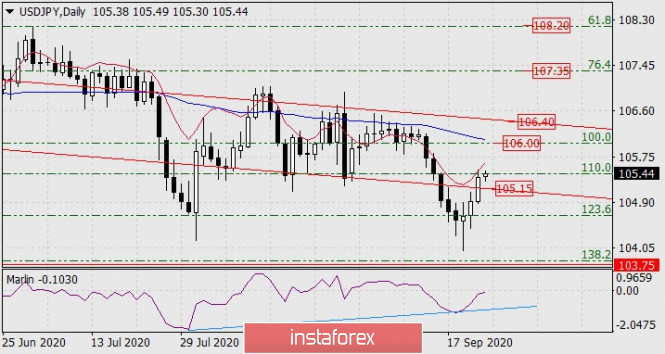
Forecast for USD/JPY on September 24, 2020
USD/JPY
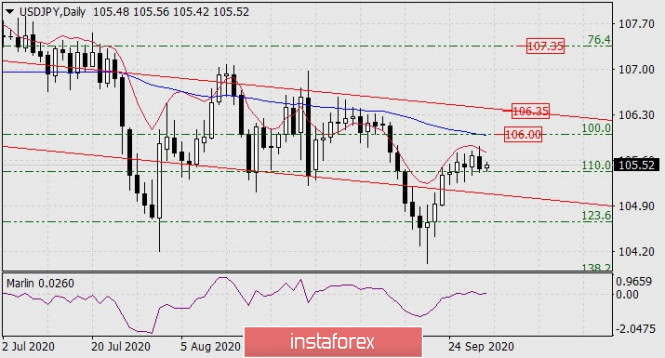
The Japanese yen broke through the price channel line and reached the intermediate Fibonacci level of 110.0% on Wednesday. The powerful convergence of the price and the Marlin oscillator continues to work, now the yen is aiming for the Fibonacci level of 106.00, or slightly higher, where the MACD line passes. But the main goal of the USD/JPY pair is the upper line of the price channel (also embedded) around the area of the 106.40 level, since overcoming it will guarantee a medium-term price growth (targets 107.35, 108.20 and higher).
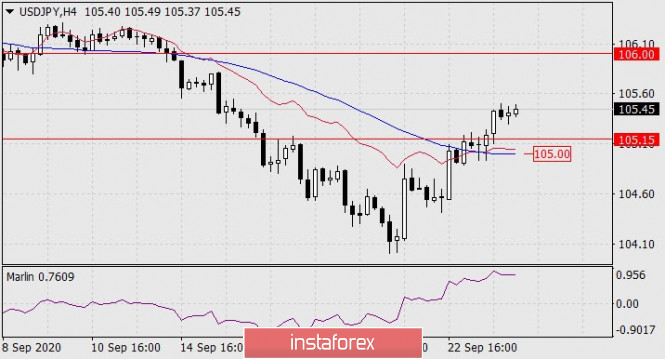
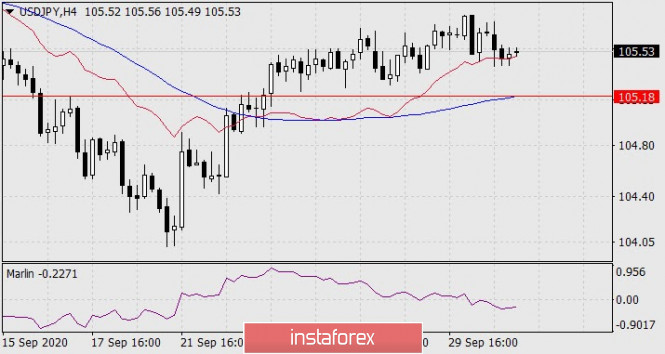
The four-hour chart shows that the price has firmly settled in the area above the balance and MACD indicator lines. The signal line of the Marlin oscillator falls into the horizon, which may be a harbinger of a local price decline in the 105.00/15 range, formed by support of the MACD line (H4) and the price channel line (daily).
Analysis are provided byInstaForex.
-
25-09-2020, 02:35 AM #3106Senior Investor
- Join Date
- Aug 2012
- Posts
- 1,942
- Feedback Score
- 0
- Thanks
- 0
- Thanked 0 Times in 0 Posts
Evening review on September 24, 2020
The EURUSD pair prospects possible decline.
The unemployment claims in the US for the long-term practically remain unchanged at 12.6 million. Note that there was a notable decrease of 700,000 just a week earlier.
Nevertheless, the euro continues to decline.
You may keep selling from 1.1735 with a stop at 1.1760.
Analysis are provided byInstaForex.
-
28-09-2020, 07:12 AM #3107Senior Investor
- Join Date
- Aug 2012
- Posts
- 1,942
- Feedback Score
- 0
- Thanks
- 0
- Thanked 0 Times in 0 Posts
Technical Analysis of GBP/USD for September 28, 2020
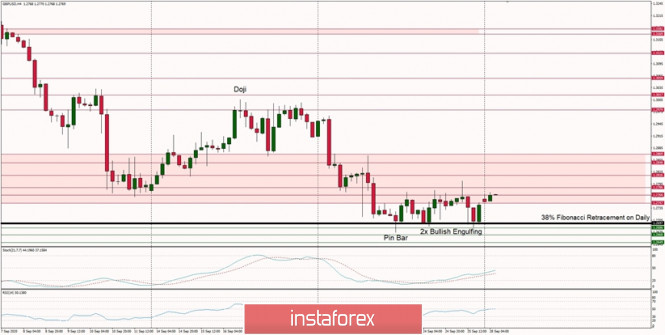
Technical Market Outlook:
The GBP/USD pair has hit the level of 1.2697 (low was made at 1.2674) and after a short period of consolidation the market is starting to bounce. This corrective bounce higher should be capped very soon, because there is a wide supply zone located between the level of 1.2747 - 1.2869 and only a sustained breakout above the level of 1.2869 would indicate the whole corrective cycle termination. Moreover, the market is bouncing from the oversold conditions on the H4 time frame chart and the momentum is slowly accelerating as well. The weekly time frame trend remains up.
Weekly Pivot Points:
WR3 - 1.3187
WR2 - 1.3072
WR1 - 1.2894
Weekly Pivot - 1.2783
WS1 - 1.2601
WS2 - 1.2494
WS3 - 1.2312
Trading Recommendations:
On the GBP/USD pair the main, multi-year trend is down, which can be confirmed by the down candles on the monthly time frame chart. The key long-term technical resistance is still seen at the level of 1.3518. Only if one of these levels is clearly violated, the main trend might reverse (1.3518 is the reversal level) or accelerate towards the key long-term technical support is seen at the level of 1.1903 (1.2589 is the key technical support for this scenario).
Analysis are provided byInstaForex.
-
29-09-2020, 06:28 AM #3108Senior Investor
- Join Date
- Aug 2012
- Posts
- 1,942
- Feedback Score
- 0
- Thanks
- 0
- Thanked 0 Times in 0 Posts
Forecast for EUR/USD on September 29, 2020
EUR/USD
The euro slightly increased on Monday amid rising risk appetite in the stock market and ahead of the first debate of presidential candidates Trump and Biden on Wednesday. Technically, the growth was reflected in consolidation at the target level of 1.1650. The observed consolidation is likely to continue today. The price must settle below the 1.1650 level in order for a significant downward movement to appear. The first target is 1.1550 (November 2017 low).
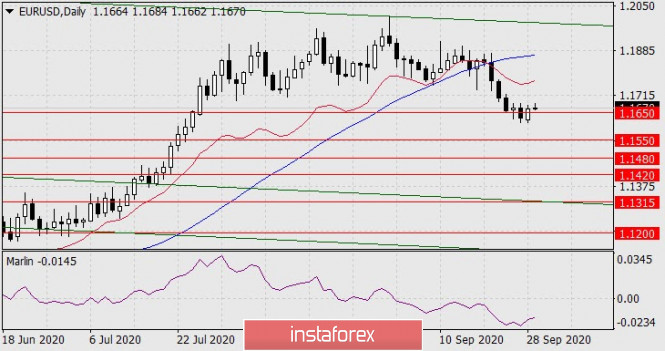
The price shows an intention to fall from the September 24 and 25 highs. It would be like forming a narrow consolidation, which in turn will act as a technical figure for the trend to continue, that is, a decline. The euro's consolidation growth may continue up to the MACD indicator line at 1.1712. We are waiting for the development of events, the main scenario is decreasing.
Analysis are provided byInstaForex.
-
30-09-2020, 07:02 AM #3109Senior Investor
- Join Date
- Aug 2012
- Posts
- 1,942
- Feedback Score
- 0
- Thanks
- 0
- Thanked 0 Times in 0 Posts
Forecast for AUD/USD on September 30, 2020
AUD/USD
The Australian dollar has created a dual growth situation this morning, which suggests a reversal towards the 0.7190 level without achieving this target. This circumstance is due to the delta in the upper lines of the trading channel of the Marlin oscillator of the daily chart. The signal line of the oscillator can make a reversal from any of them, either from the blue line or from the green line. This shows us how false the growing movement can be if it begins to develop. The price staying above 0.7190 with Marlin entering the zone of positive values will be a sign of price growth. The first target will be the 0.7270 level .
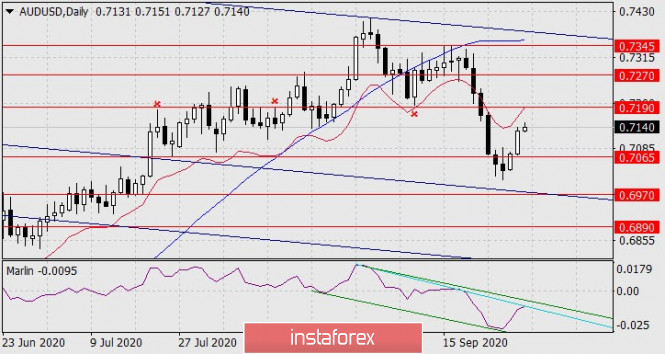
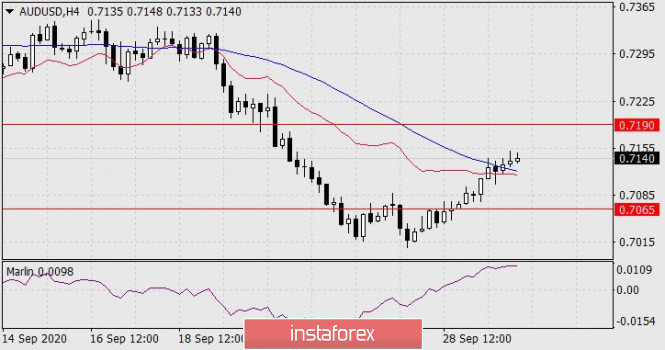
The price has settled above the MACD line on the four-hour chart, but the Marlin oscillator is marking a reversal, at the moment its signal line is moving horizontally. In a short amount of time, the price may return to the area under this line and settle below it. In this case, and this is the main scenario, the aussie will aim for 0.7065. Consolidating below it opens the second target at 0.6970.
Analysis are provided byInstaForex.
-
01-10-2020, 06:37 AM #3110Senior Investor
- Join Date
- Aug 2012
- Posts
- 1,942
- Feedback Score
- 0
- Thanks
- 0
- Thanked 0 Times in 0 Posts
Forecast for USD/JPY on October 1, 2020
USD/JPY
USD/JPY fell by 18 points while investors were temporarily confused on Wednesday, stopping at the 110.0% Fibonacci level on the daily chart. The pair is planning to go up from this level during the Asian session. The Marlin oscillator is staying in the growth zone. We are waiting for the next branch of growth at the target of 106.00 - at the Fibonacci level of 100.0% and the MACD line coinciding with it.
The price is held by the balance indicator line on the four-hour chart, the general trend is growing. The Marlin oscillator has been declining for a long time while the price increases, you can look at this as the indicator easing from the overbought zone before it grows further. We are waiting for the price to reach the designated target.
Analysis are provided byInstaForex.
-
Sponsored Links


 Reply With Quote
Thread Information
Users Browsing this Thread
There are currently 1 users browsing this thread. (0 members and 1 guests)
 Posting Permissions
24 Hour Gold

Advertising
- Over 20.000 UNIQUE Daily!
- Get Maximum Exposure For Your Site!
- Get QUALITY Converting Traffic!
- Advertise Here Today!
Out Of Billions Of Website's Online.
Members Are Online From.
- Get Maximum Exposure For Your Site!
- Get QUALITY Converting Traffic!
- Advertise Here Today!
Out Of Billions Of Website's Online.
Members Are Online From.


