
 LinkBack URL
 About LinkBacks
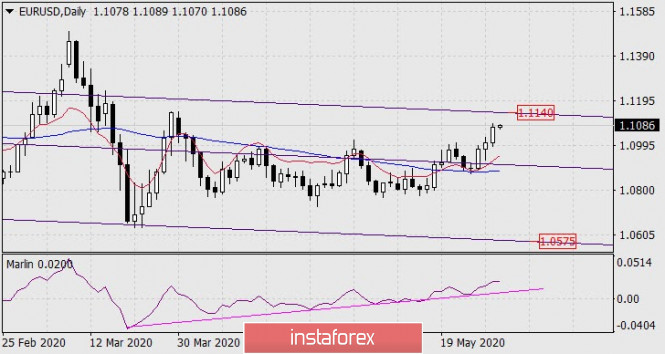
Forecast for EUR/USD on May 29, 2020
EUR/USD
Yesterday, investors' expectations for positive US data did not materialize. The volume of orders for durable goods fell by 17.2% in April after a previous drop of 14.7%. The forecast was -19.0%, but of -17.2% optimism, of course, does not cause. The second estimate of GDP for the first quarter was revised down from -4.8% to -5.0% against the forecast without change (i.e. -4.8%). As a result, the dollar index lost -0.47%, the euro grew by 68 points, the S&P 500 fell by 0.21%. Macro statistics do not have to wait for optimism to an even greater extent today. The forecast for personal incomes of consumers for April is -7.0%, for personal expenses -12.6% versus the March contraction of -7.5%. The index of business activity in the manufacturing sector of the Chicago region in May is expected to increase from 35.4 to 40.1, but here (in the spirit of the times) there is a great emotional component, so the data may turn out to be worse.
The euro is moving towards its first target of 1.1140 on the daily chart. Whether there will be a price reversal from this level or the euro will continue to grow higher is currently not clear, since there are no prerequisites for technical signs in any direction. Price in a local situation is a leading factor, indicators in a guided position.
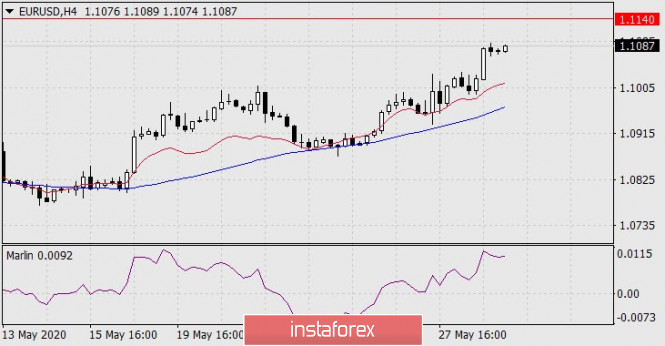
The price and indicators are growing on the H4 chart, there are no signs of a reversal. We are waiting for the price on the embedded line of the price channel of 1.1140.
*The market analysis posted here is meant to increase your awareness, but not to give instructions to make a trade.
Analysis are provided byInstaForex.
Please visit our sponsors
Results 3,021 to 3,030 of 4086
Thread: InstaForex Wave Analysis
-
29-05-2020, 07:06 AM #3021Senior Investor


- Join Date
- Aug 2012
- Posts
- 1,942
- Feedback Score
- 0
- Thanks
- 0
- Thanked 0 Times in 0 Posts

-
01-06-2020, 07:39 AM #3022Senior Investor
- Join Date
- Aug 2012
- Posts
- 1,942
- Feedback Score
- 0
- Thanks
- 0
- Thanked 0 Times in 0 Posts
Technical Analysis of ETH/USD for June 1, 2020:
Company does not offer investment advice and the analysis performed does not guarantee results. The market analysis posted here is meant to increase your awareness, but not to give instructions to make a trade.
Crypto Industry News:
The Cyble Research Team has conducted research that showed that data on more than 80,000 credit cards around the world has been put up for sale at Darknet.
According to the information, the data leakage concerned credit card users from various countries, such as the United States (33,000), France (14,000), Australia (5,000), United Kingdom (5,000), Canada (2,000) .), Singapore (1.2 thousand) and India (1.3 thousand). According to the message from Cyble, these are both Visa and Matercard. Each of them contains the cardholder's surname, CVV number and expiry date. The price of these cards is $ 5 in crypto, and is independent of their value in a world outside of Darknet.
According to research, information about the countries where the cards come from was disclosed due to a billing data leak. This information included the address of each cardholder, making it easier for cyber security companies to determine the country of origin of each card.
It's not entirely clear where the hackers stole their card details, but Cyble thinks they may come from a phishing site or online stores that the hackers attacked. Cybele created a special search engine so that people could check if their personal data leaked into Darknet. In total, the company's database contains over 40 billion records.
Technical Market Outlook:
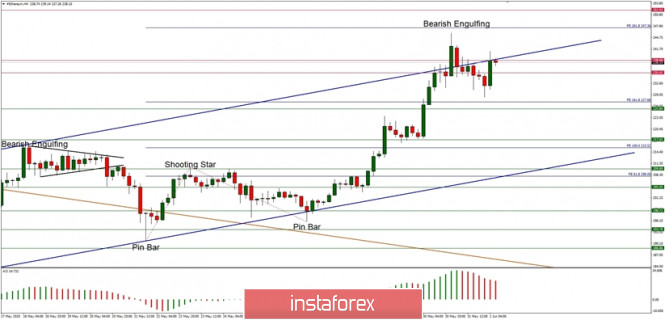
The ETH/USD pair has been hovering around the level of $235 for all the weekend and made a new local high at the level of $241.06. This level is just in line with the upper parallel channel line, so it might act as a dynamic resistance despite the fact that it was violated recently. The momentum is not increasing at the alarming rate, so some kind of a corrective pull-back is expected. The target level for correction is seen at $225.84, but the larger time-frame trend remains up. The next target for bulls is seen at 261% Fibonacci extension at $247.36.
Weekly Pivot Points:
WR3 - $307.85
WR2 - $277.87
WR1 - $257.91
Weekly Pivot - $226.70
WS1 - $208.30
WS2 - $176.78
WS3 - $157.13
Trading Recommendations:
The larger time frame trend on Ethereum remains down and as long as the level of $288 is not violated, all rallies will be treated as a counter-trend corrective moves. This is why the short positions are now more preferred. The next key technical support is seen at the level of $174.82.
Analysis are provided byInstaForex.
-
02-06-2020, 07:31 AM #3023Senior Investor
- Join Date
- Aug 2012
- Posts
- 1,942
- Feedback Score
- 0
- Thanks
- 0
- Thanked 0 Times in 0 Posts
Technical Analysis of EUR/USD for June 2, 2020:
Technical Market Outlook:
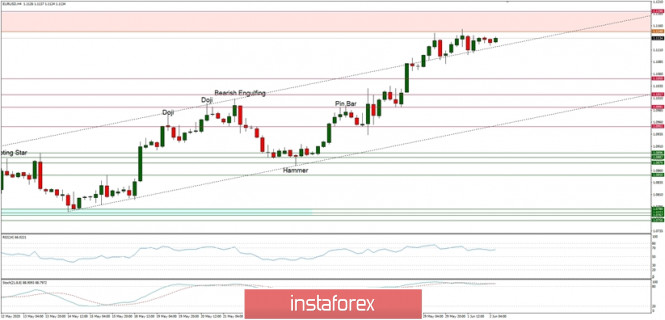
The EUR/USD pair has been consolidating the recent gains in a narrow zone located between the levels of 1.1148 - 1.1100. The bulls are hovering just below the lower supply zone boundary located between the levels of 1.1148 - 1.1190. Please notice, the market conditions are now overbought and despite the positive and strong momentum the price might start a corrective pull-back towards the nearest technical support located at the level of 1.1050.
Weekly Pivot Points:
WR3 - 1.1499
WR2 - 1.1307
WR1 - 1.1241
Weekly Pivot - 1.1045
WS1 - 1.0959
WS2 - 1.0772
WS3 - 1.0680
Trading Recommendations:
On the EUR/USD pair the main long term trend is down, but the local up trend continues. The key long-term technical support is seen at the level of 1.0336 and the key long-term technical resistance is seen at the level of 1.1540. Only if one of this levels is clearly violated, the main trend might reverse (1.1540) or accelerate (1.0336).
Company does not offer investment advice and the analysis performed does not guarantee results. The market analysis posted here is meant to increase your awareness, but not to give instructions to make a trade.
Analysis are provided byInstaForex.
-
03-06-2020, 07:22 AM #3024Senior Investor
- Join Date
- Aug 2012
- Posts
- 1,942
- Feedback Score
- 0
- Thanks
- 0
- Thanked 0 Times in 0 Posts
Forecast for EUR/USD on June 3, 2020
EUR/USD
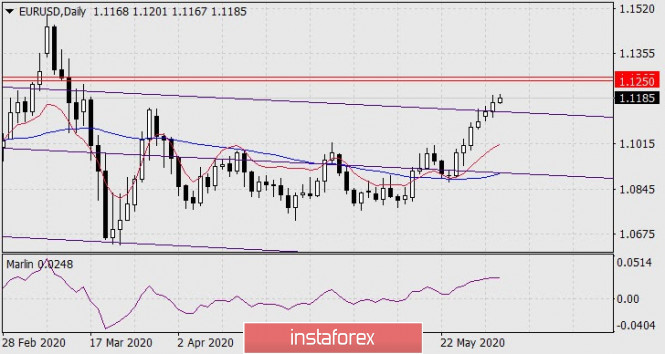
Risk appetites continue to grow despite protests and riots in the US: S&P 500 gained 0.82% yesterday, gold fell 0.69%, yield on 5-year US government bonds rose from 0.31% to 0, 32% The euro grew by 35 points, gaining a foothold on the daily chart over the trend line of the price channel. Target of 1.1250/65 is open.
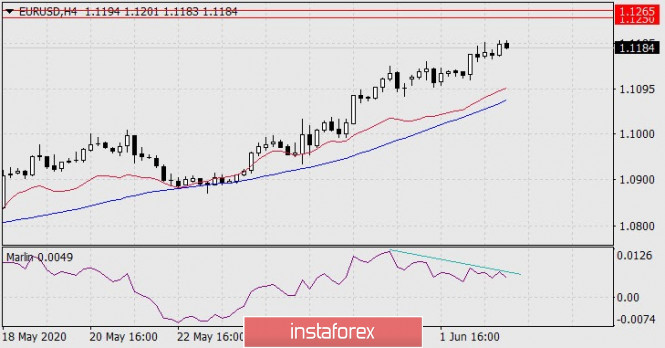
The price is growing in a stable trend on the four-hour chart, but the Marlin oscillator has formed a divergence. With an increase in the price of another 15 points, the divergence can be reorganized into a regular pullback of the indicator (indicator discharge) with the resumption of growth. We are waiting for the price in the specified target range, where it is possible to form a more stable reversal pattern.
Analysis are provided byInstaForex.
-
04-06-2020, 07:13 AM #3025Senior Investor
- Join Date
- Aug 2012
- Posts
- 1,942
- Feedback Score
- 0
- Thanks
- 0
- Thanked 0 Times in 0 Posts
Forecast for EUR/USD on June 4, 2020
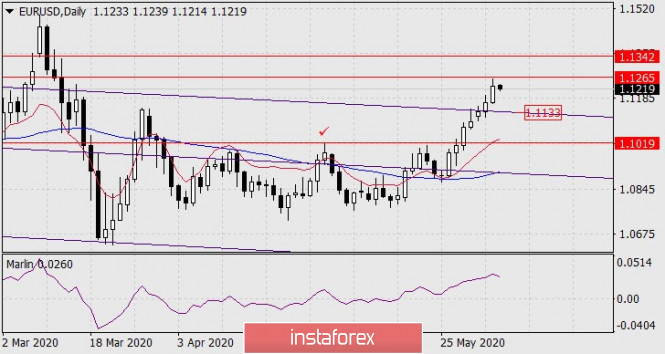
EUR/USD
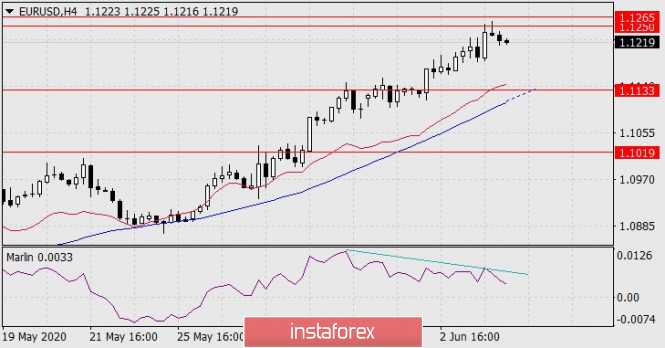
Yesterday, the euro reached the target range of 1.1250/65 and today, with the support of the Marlin oscillator turning down, it is ready to head for a correction. The purpose of the correction is the embedded line of the price channel in the region of 1.1133. Consolidating the price below it opens a deeper target 1.1019 (May 1 high). If the price goes above the upper boundary of the target range of 1.1265, the second bullish target at 1.1342 will open.
The divergence on the Marlin oscillator still formed on the four-hour chart (yesterday we questioned the formation of this reversal pattern). Target level at 1.1133 coincides with the MACD line, which it is aiming for. Working out this correction level is our main scenario.
Analysis are provided byInstaForex.
-
05-06-2020, 07:19 AM #3026Senior Investor
- Join Date
- Aug 2012
- Posts
- 1,942
- Feedback Score
- 0
- Thanks
- 0
- Thanked 0 Times in 0 Posts
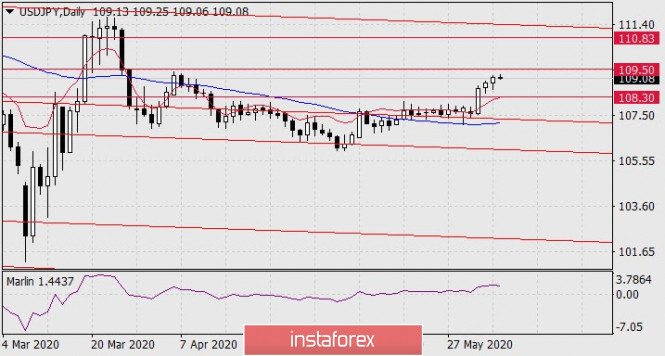
Forecast for USD/JPY on June 5, 2020
USD/JPY The dollar continued to grow against the yen yesterday (23 percentage points) despite the decline in stock indices: the S&P 500 was down -0.34%, while the Nikkei 225 is losing -0.32% in the Asian session today. It seems that investors are counting on good US employment data today and continued growth in related markets. If such expectations are met, then with the price overcoming the first target level of 109.50, growth will continue to the second target level of 110.83 (November 2017 low).
A weak divergence has formed on the Marlin oscillator on the four-hour chart, the structure is more similar to the indicator discharging before further growth. But this pattern is also a harbinger of increased intraday volatility, which is quite consistent with today's release of important US data.
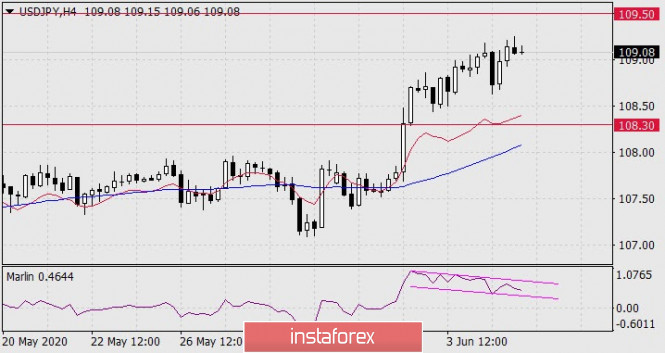
We are waiting for a clarification of the situation - whether investors will change their minds to buy risk.
Analysis are provided byInstaForex.
-
08-06-2020, 07:15 AM #3027Senior Investor
- Join Date
- Aug 2012
- Posts
- 1,942
- Feedback Score
- 0
- Thanks
- 0
- Thanked 0 Times in 0 Posts
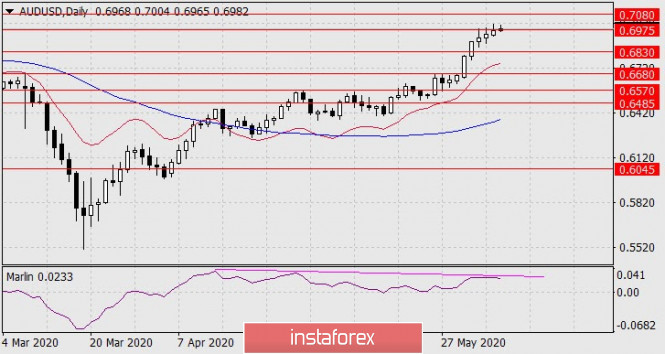
Forecast for AUD/USD on June 8, 2020
AUD/USD The Australian dollar is moving sideways at a target level of 0.6975 since Friday last week as well this morning. The sideways movement increased the technical divergence on the Marlin oscillator. We are waiting for the movement to the first support of 0.6830.
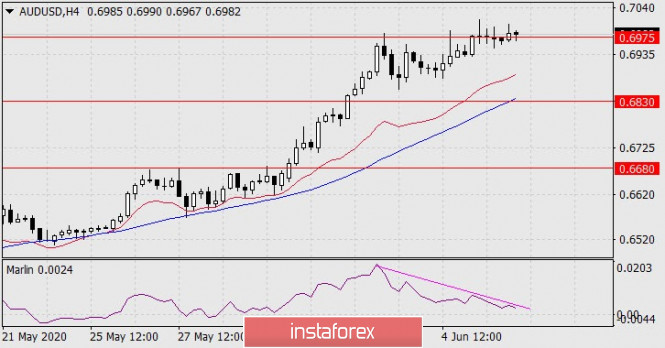
The Marlin divergence has also developed on the four-hour chart, the signal line of the oscillator is attacking the border of the downward trend territory. If the price consolidates below 0.6830, the price will also go under the MACD indicator line, respectively, the fall will likely continue towards the lower target of 0.6680.
Analysis are provided byInstaForex.
-
09-06-2020, 07:22 AM #3028Senior Investor
- Join Date
- Aug 2012
- Posts
- 1,942
- Feedback Score
- 0
- Thanks
- 0
- Thanked 0 Times in 0 Posts
Forecast for EUR/USD on June 9, 2020
EUR/USD
The euro closed at the opening level on Monday, supported by the target level of 1.1265. The Marlin oscillator has strengthened the decline on a daily basis. On the first attempt, the price failed to overcome the immediate support, today we are waiting for a more successful attempt. Target at 1.1200.
Price taking above support at 1.1265 is visible on the H4 chart. The signal line of the Marlin oscillator is on the territory of the declining trend - in the lower half of negative values. We are waiting for the price to try overcoming the nearest support and decrease to 1.1200 and further to 1.1125 - to the price channel line on the daily.
Analysis are provided byInstaForex.
-
10-06-2020, 06:55 AM #3029Senior Investor
- Join Date
- Aug 2012
- Posts
- 1,942
- Feedback Score
- 0
- Thanks
- 0
- Thanked 0 Times in 0 Posts
USA on verge of bankruptcy

The Economist columnist John Williams believes that the unprecedented printing of money may lead to runaway inflation and the depreciation of the global currencies. In his opinion, the US financial system has totally gone the limit and will save not only every bank, but also every financial institution as well as the stock market.
The expert also claims that the real unemployment rate in the US is 35% now instead of 13% reported by the US Labor Department. His opinion is well-founded, as Mr. Williams is the creator of the Shadowstats website. He claims that there, statistics is collected without tricks that are regularly used by the government to make numbers look better.
John Williams considers that the US GDP will fall by about 50% in the second quarter thus hitting the bottom. A real renewal should be expected no earlier than in the fourth quarter because in April, the US industrial production slumped to a record low over the past century. Besides retail sales fell by 60-80%.
He believes that the price of gold and silver will rise significantly very soon.
Analysis are provided byInstaForex.
-
11-06-2020, 07:08 AM #3030Senior Investor
- Join Date
- Aug 2012
- Posts
- 1,942
- Feedback Score
- 0
- Thanks
- 0
- Thanked 0 Times in 0 Posts
Forecast for EUR/USD on June 11, 2020
EUR/USD
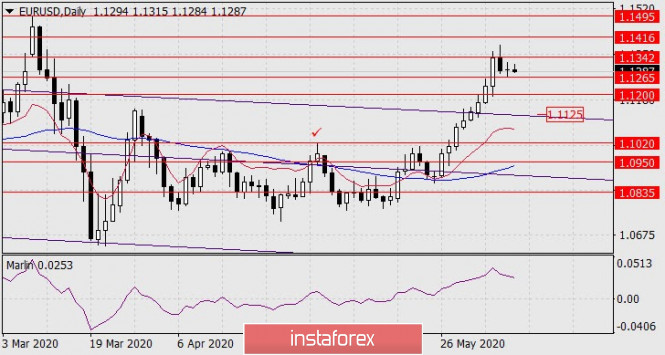
Yesterday, the Federal Reserve announced its forecasts for the economy: GDP at 6.5% for 2020, and 5.0% for 2021, inflation forecast for this year was 0.8%, and 1.6% for the future. The regulator expects an unemployment rate of 9.3% this year and 6.5% in the year 2021. The dollar index lost 0.32%, while the euro grew by 33 points. The only forecast of the Fed which raises a clear doubt, is the forecast for inflation. The release of huge money supply into the open market in the framework of combating the epidemic and supporting the unemployed population cannot but cause much stronger inflation. Very soon, the Fed will be forced to raise rates even contrary to an earlier promise not to do so before the end of the year. However, for the remaining six months, you can still manipulate statistics so that this is not very obvious, and shift the focus from developing inflation to employment problems. As a result, the euro is unlikely to continue to strengthen on yesterday's data from the Fed, investors understand the unreliability of these forecasts.
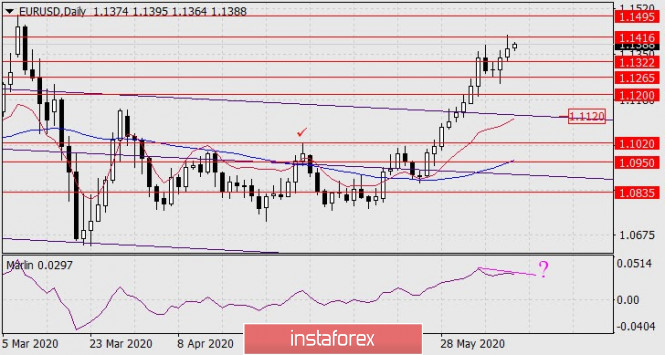
The euro is staying in the range of target levels 1.1322-1.1416. According to the Marlin oscillator, a small divergence forms on the daily chart, but this can become a reversal signal.
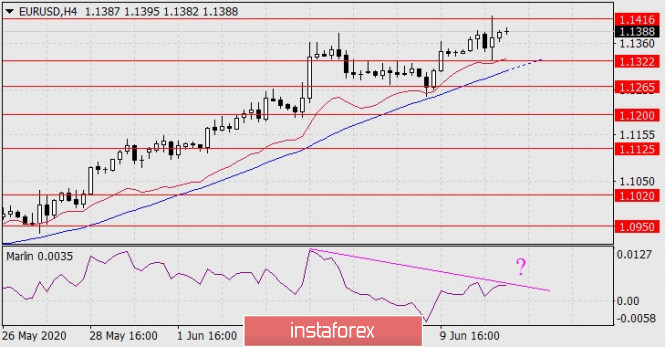
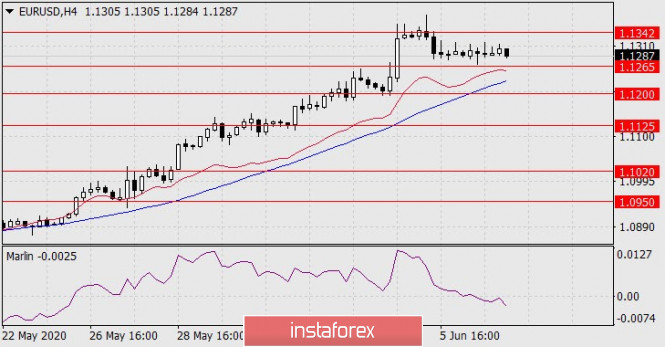
Divergence is more pronounced on the four-hour chart. Consolidating the price under 1.1322, which will also correspond to the price falling below the MACD line (it is going up), opens the underlying consecutive goals: 1.1265, 1.1200, 1.1125.
Consolidating the price over 1.1416 may extend the current branch to 1.1495.
Analysis are provided byInstaForex.
-
Sponsored Links


 Reply With Quote
Thread Information
Users Browsing this Thread
There are currently 1 users browsing this thread. (0 members and 1 guests)
 Posting Permissions
24 Hour Gold

Advertising
- Over 20.000 UNIQUE Daily!
- Get Maximum Exposure For Your Site!
- Get QUALITY Converting Traffic!
- Advertise Here Today!
Out Of Billions Of Website's Online.
Members Are Online From.
- Get Maximum Exposure For Your Site!
- Get QUALITY Converting Traffic!
- Advertise Here Today!
Out Of Billions Of Website's Online.
Members Are Online From.


