
 LinkBack URL
 About LinkBacks
Elliott wave analysis of EUR/NZD for June 19, 2018
Our short-term expectations for EUR/NZD was spot on. First, we saw a minor corrective set-back to 1.6671 (we were looking for 1.6676) before moving higher to 1.6795 (we were looking for a rally into the 1.6768 - 1.6793 area to complete the first impulsive rally of the 1.6567 low. With this five wave rally complete with the test of 1.6795 we will be looking for a correction in wave ii/ into the 1.6652 - 1.6679 area before moving higher in wave iii/ towards at least 1.7047.
R3: 1.6842
R2: 1.6817
R1: 1.6794
Pivot: 1.6758
S1: 1.6728
S2: 1.6695
S3: 1.6671
Trading recommendation:
We will sell EUR here at 1.6772 and place our stop at 1.6845. We will take profit and buy EUR at 1.6680
*The market analysis posted here is meant to increase your awareness, but not to give instructions to make a trade.
Analysis are provided byInstaForex.
Please visit our sponsors
Results 2,561 to 2,570 of 4086
Thread: InstaForex Wave Analysis
-
19-06-2018, 06:40 AM #2561Senior Investor


- Join Date
- Aug 2012
- Posts
- 1,942
- Feedback Score
- 0
- Thanks
- 0
- Thanked 0 Times in 0 Posts

-
20-06-2018, 05:10 AM #2562Senior Investor
- Join Date
- Aug 2012
- Posts
- 1,942
- Feedback Score
- 0
- Thanks
- 0
- Thanked 0 Times in 0 Posts
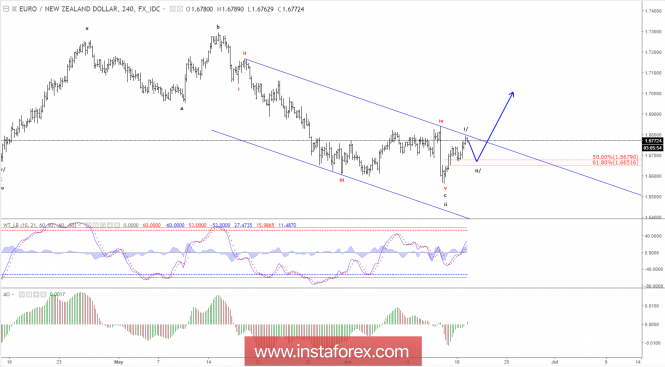
Elliott wave analysis of EUR/NZD for June 20, 2018
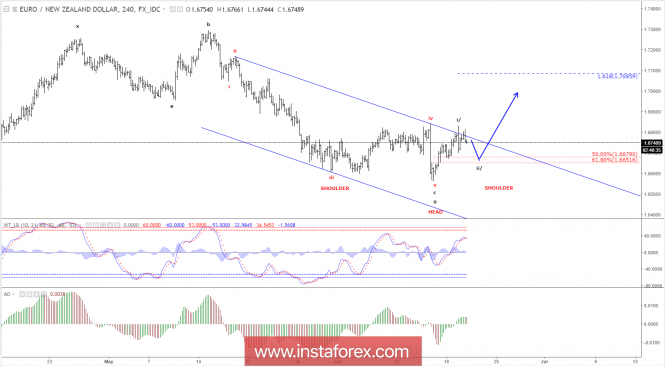
Wave i/ extended higher to a peak at 1.6831 before letting wave ii take over for a correction lower to at least the low of wave four of one lesser degree at 1.6671. This is very close to the 61.8% corrective target of wave i/ seen at 1.6667. Once this correction is complete near the 1.6667 - 1.6671 area, we will be looking for wave iii/ higher to at least 1.7086.
Short-term, we expect minor resistance at 1.6766 to be able to cap the upside for the decline into the 1.6667 - 1.6671 area to complete wave ii/.
R3: 1.6830
R2: 1.68.12
R1: 1.6788
Pivot: 1.6766
S1: 1.6729
S2: 1.6700
S3: 1.6680
Trading recommendation: We are short EUR from 1.6772 and we will move our stop +revers lower to 1.6815. We will take profit and buy EUR at 1.6680.
*The market analysis posted here is meant to increase your awareness, but not to give instructions to make a trade.
Analysis are provided byInstaForex.
-
21-06-2018, 06:46 AM #2563Senior Investor
- Join Date
- Aug 2012
- Posts
- 1,942
- Feedback Score
- 0
- Thanks
- 0
- Thanked 0 Times in 0 Posts
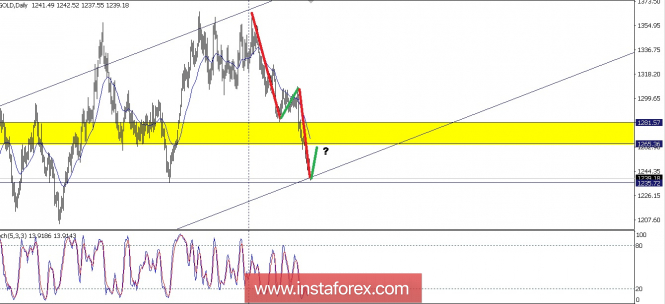
Technical analysis of Gold June 21, 2018
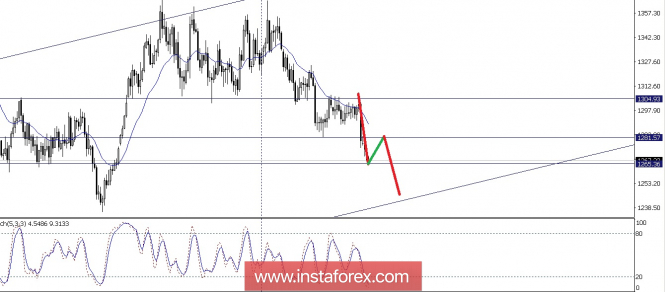
If We look at the Daily Charts from Gold, We can see clearly they moving in Weekly Up Slope Channel, and now they have a retracement to the down side as long as they not breakout and close above the 1304.93 Gold will going down 1236.09 as their Support level.
*The market analysis posted here is meant to increase your awareness, but not to give instructions to make a trade.
Analysis are provided byInstaForex.
-
22-06-2018, 06:25 AM #2564Senior Investor
- Join Date
- Aug 2012
- Posts
- 1,942
- Feedback Score
- 0
- Thanks
- 0
- Thanked 0 Times in 0 Posts
Elliott wave analysis of EUR/NZD for June 22, 2018
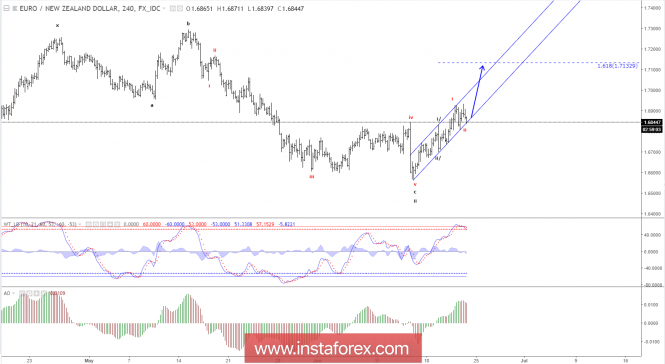
The minor correction we expected from 1.6921 moved slightly lower than expected and spiked down to 1.6806, but that does not change our outlook for a new impulsive rally soon towards 1.7133 and above.
Short-term, we could see another minor spike to near 1.6806 before the next move higher should be expected.
Only an unexpected break below support at 1.6737 will question our bullish outlook.
R3: 1.7025
R2: 1.6964
R1: 1.6933
Pivot: 1.6890
S1: 1.6837
S2: 1.6784
S3: 1.6737
Trading recommendation:
We are long EUR from 1.6815 with our stop placed at 1.6730. If you are not long EUR yet, then buy near 1.6806 or upon a break above 1.6933 and use the same stop at 1.6730.
*The market analysis posted here is meant to increase your awareness, but not to give instructions to make a trade.
Analysis are provided byInstaForex.
-
25-06-2018, 05:59 AM #2565Senior Investor
- Join Date
- Aug 2012
- Posts
- 1,942
- Feedback Score
- 0
- Thanks
- 0
- Thanked 0 Times in 0 Posts
Elliott wave analysis of EUR/JPY for June 25, 2018
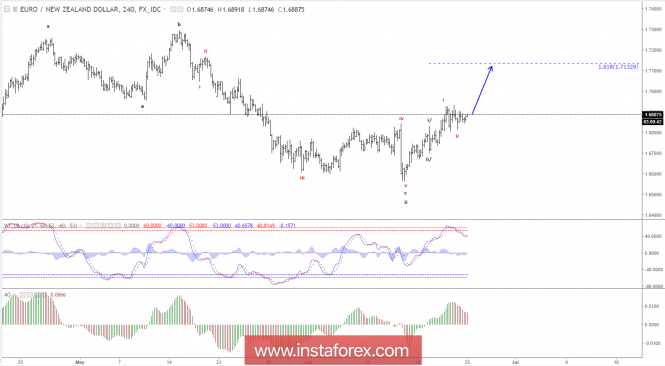
We continue to look for more upside here. A break above minor resistance at 1.6933 will call for a continuation higher towards 1.7133 as the next minor upside target on the way higher. Support is now seen at 1.6806 and is expected to be able to protect the downside for a break above 1.6933.
R3: 1.7025
R2: 1.6964
R1: 1.6933
Pivot: 1.6890
S1: 1.6837
S2: 1.6806
S3: 1.6784
Trading recommendation:
We are long EUR from 1.6815 with our stop placed at 1.6730. If you are not long EUR yet, then buy near 1.6806 or upon a break above 1.6933 and use the same stop at 1.6730.
Analysis are provided byInstaForex.
-
26-06-2018, 06:11 AM #2566Senior Investor
- Join Date
- Aug 2012
- Posts
- 1,942
- Feedback Score
- 0
- Thanks
- 0
- Thanked 0 Times in 0 Posts
Trading Plan for Crude Oil for June 26, 2018
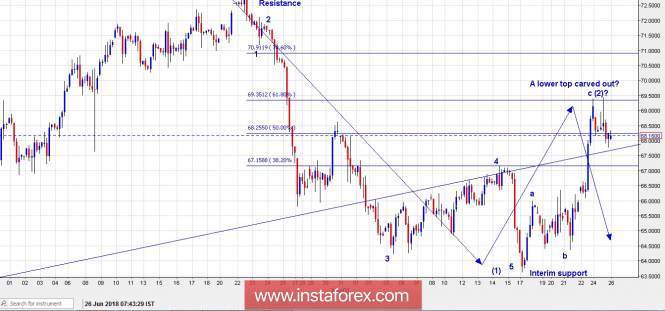
Technical outlook:
A medium-term time frame has been presented (4 hours) here, and the most probable wave counts have been labelled here. It looks to be like a bearish resumption trade setup is getting ready in Crude Oil now. Let us understand the wave counts from sub 73.00 levels. The drop from 73.00 to almost 63.50 has been an impulse (unfolding into 5 waves) as labeled here. The entire drop can be labeled as wave (1). The subsequent rally then unfolded into a probable Zigzag (5-3-5) corrective wave structure, labeled as a-b-c here. Also note that the termination of the wave (2) is just at Fibonacci 0.618 resistance, around 69.50 levels, which triggered a sharp reversal yesterday. if this ave structure holds to be good, we should witness a continued drop lower towards 58.00 and 48.00 respectively. Ideally, prices should now stay below 73.00 levels going forward.
Trading plan:
Remain short now, stop above 73.00, target 58.00 at least.
Fundamental outlook:
Watch out for US Consumer confidence numbers to be out today at 10:00 AM EST.
Analysis are provided byInstaForex.
-
27-06-2018, 09:22 AM #2567Senior Member

- Join Date
- Feb 2013
- Posts
- 212
- Feedback Score
- 0
- Thanks
- 0
- Thanked 0 Times in 0 Posts
Technical analysis on Gold for June 27, 2018
Gold price remains in a bearish trend. Price is approaching important weekly support levels and at least a short-term bounce is approaching. Gold price has weekly oversold signals, warning not to be bearish at current levels. We have no reversal confirmation yet, but we believe that soon we will see the reversal. The key level is at $1,268.
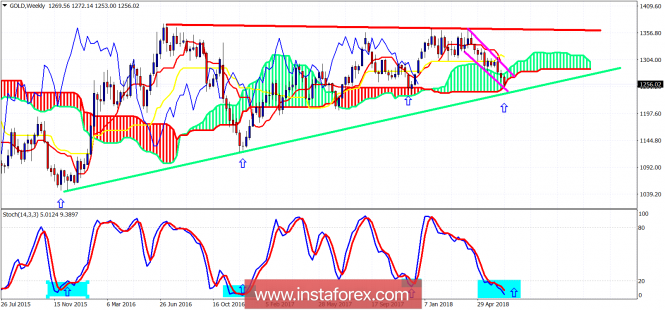
Green line - long-term support
Red line - long-term resistance
Blue arrows - reversal points when Stochastic was oversold.
Gold price is challenging the weekly cloud support and the weekly upward sloping trend line. All the previous times the stochastic was so oversold, Gold rallied. Our time frame is for the next 1-2 months and therefore our risk tolerance should be similar to the downside. Our target remains new highs above $1,400.
*The market analysis posted here is meant to increase your awareness, but not to give instructions to make a trade.
-
28-06-2018, 08:36 AM #2568Senior Member
- Join Date
- Feb 2013
- Posts
- 212
- Feedback Score
- 0
- Thanks
- 0
- Thanked 0 Times in 0 Posts
Technical analysis of USD/CAD for June 28, 2018
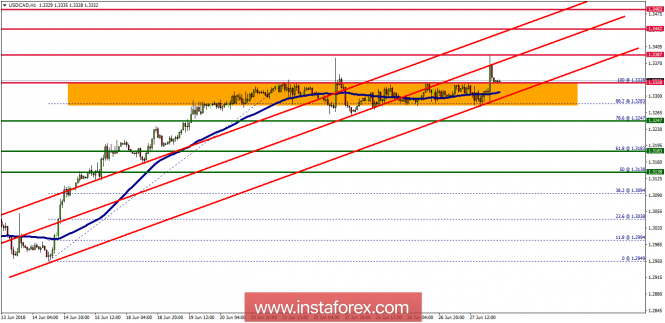
Overview:
The USD/CAD pair broke the resistance that turned into strong support at the level of 1.3247 since days. The level of 1.3247 coincides with the ratio of 78.6% Fibonacci which is expected to act as a major support on the H1 chart today. Consequently, the first support is set at the level of 1.3247. Moreover, the RSI starts signaling an upward trend, and the trend is still showing strength above the moving average (100). Hence, the market is indicating a bullish opportunity above the area of 1.3247/1.3300. So, the market is likely to show signs of a bullish trend around 1.3247 - 1.3300. In other words, buy orders are recommended above the ratio of 78.6% Fibonacci (1.3247) with the first target at the level of 1.3387 in order to test the first resistance in the same time frame. If the pair succeeds to pass through the level of 1.3387, the market will probably continue towards the next objective at 1.3442. The daily strong support is seen at 1.3247. Thus, if a breakout happens at the support level of 1.3243, then this scenario may be invalidated.
*The market analysis posted here is meant to increase your awareness, but not to give instructions to make a trade.
-
29-06-2018, 08:10 AM #2569Senior Member
- Join Date
- Feb 2013
- Posts
- 212
- Feedback Score
- 0
- Thanks
- 0
- Thanked 0 Times in 0 Posts
Technical analysis of USD/CHF for June 29, 2018
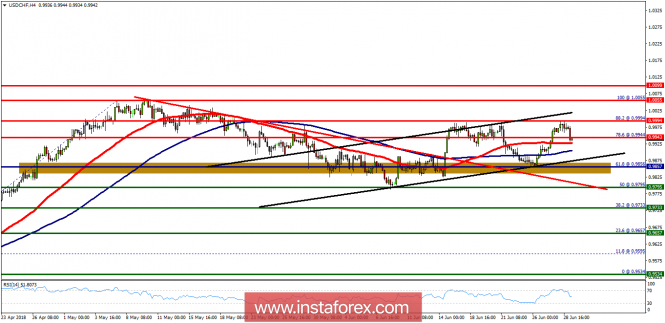
The USD/CHF pair faced resistance at the level of 0.9943. The strong resistance has been already formed at the level of 0.9943 and the pair is likely to try to approach it in order to test it again. However, if the pair fails to pass through the level of 0.9943, the market will indicate a bearish opportunity below the new strong resistance level of 0.9943 (the level of 0.9943 coincides with a ratio of 78.6% Fibonacci). Moreover, the RSI starts signaling a downward trend, as the trend is still showing strength above the moving average (100) and (50). Thus, the market is indicating a bearish opportunity below 0.9943, so it would be good to sell at 0.9940 with the first target of 0.9795. It will also call for a downtrend in order to continue towards 0.9733. The daily strong support is seen at 0.9733. On the other hand, the stop loss order should always be taken into account, for that it will be reasonable to set your stop loss at the level of 1.0055 (the double top on the H4 chart).
*The market analysis posted here is meant to increase your awareness, but not to give instructions to make a trade.
-
03-07-2018, 06:36 AM #2570Senior Member
- Join Date
- Feb 2013
- Posts
- 212
- Feedback Score
- 0
- Thanks
- 0
- Thanked 0 Times in 0 Posts
Technical analysis of Gold for July 03, 2018
From the Daily Charts we know the Gold bias is still in a Bullish Condition, this can be seen by the Gold still moving in an up Channel event. Now Gold has a correction and tries to test the nearest Support level at 1,235.72 but it seems that in a few days Gold will be back to its previous bias (Bull). This is already confirmed by the Stochastic Oscilator now at the Oversold level and preparr to go up above the 20 level, so the next few days ahead it seems the Gold will go back to the previous bias (Bull). (Dsiclaimer)
*The market analysis posted here is meant to increase your awareness, but not to give instructions to make a trade.
-
Sponsored Links


 Reply With Quote
Thread Information
Users Browsing this Thread
There are currently 2 users browsing this thread. (0 members and 2 guests)
 Posting Permissions
24 Hour Gold

Advertising
- Over 20.000 UNIQUE Daily!
- Get Maximum Exposure For Your Site!
- Get QUALITY Converting Traffic!
- Advertise Here Today!
Out Of Billions Of Website's Online.
Members Are Online From.
- Get Maximum Exposure For Your Site!
- Get QUALITY Converting Traffic!
- Advertise Here Today!
Out Of Billions Of Website's Online.
Members Are Online From.


