
 LinkBack URL
 About LinkBacks
The export of the eurozone is in order
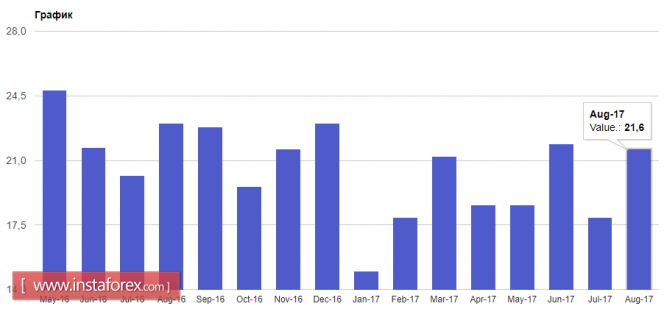
The euro managed to return a number of positions in relation to the US dollar after the release of good data on the growth of exports of goods from the eurozone in August this year. The absence of other important macroeconomic statistics forced large investors to refrain from further buying the US dollar after Friday's fluctuations.
According to the Eurostat report, eurozone exports in August increased by 2.5% compared to July, while imports increased by only 0.4%. The positive balance of foreign trade in goods in the eurozone in August 2017 amounted to 21.6 billion euros, against the 17.9 billion euros in July.
After such data, it can be concluded that the sharp increase in the European currency in the first half did not significantly affect the export sector, which will positively affect the overall indicator of the eurozone economy in 2017.
Good data on the growth of production activity in the area of responsibility of the Federal Reserve Bank of New York did not provide significant support to the US dollar in the afternoon. According to the report of the Fed-New York, the production index in October 2017 increased by 5.8 points, to 30.2 points. Forty-four percent of respondents said about improvement of conditions, while 14% of respondents said that conditions worsened. Economists had expected the index to be 20 points.
As for the technical picture of the EURUSD pair, only a break and consolidation above the level of 1.1830 could lead to the return of the trading instrument to the area of monthly highs, which will allow us to count on continuing the upward trend in risky assets in order to update the levels of 1.1900 and 1.1950. For the time being, the trade is in the level of 1.1800. The pressure on the European currency will continue to be maintained, which will allow the sellers of risky assets to expect the continued decline of EURUSD already in the region of monthly lows in the range of 1.1690 and for their renewal in the 1.1630 and 1.1600 areas.
Today it also became known that the budget surplus of Greece has grown. According to the Ministry of Finance of the country, over the past 9 months of this year, the budget surplus of Greece amounted to 4.54 billion euros. However, it was not possible to reach the target level due to a reduction in tax revenues. According to the Ministry of Finance, budget revenues from January to September amounted to 36 billion euros, which is below the target level of 2.4 billion euros.
Analysis are provided byInstaForex.
Please visit our sponsors
Results 2,411 to 2,420 of 4086
Thread: InstaForex Wave Analysis
-
17-10-2017, 05:46 AM #2411Senior Investor


- Join Date
- Aug 2012
- Posts
- 1,942
- Feedback Score
- 0
- Thanks
- 0
- Thanked 0 Times in 0 Posts

-
18-10-2017, 06:24 AM #2412Senior Investor
- Join Date
- Aug 2012
- Posts
- 1,942
- Feedback Score
- 0
- Thanks
- 0
- Thanked 0 Times in 0 Posts
Technical analysis of EUR/USD for Oct 18, 2017
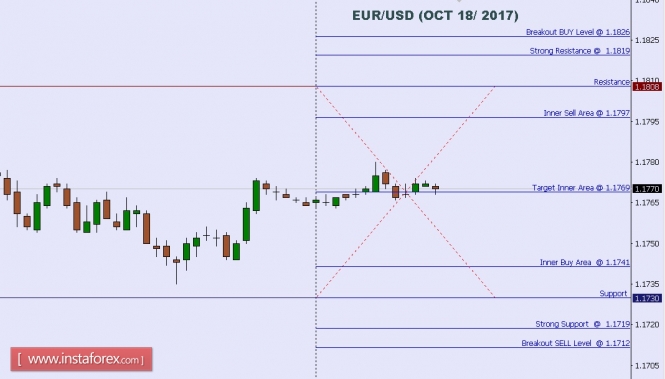
When the European market opens, some Economic Data will be released, such as German 30-y Bond Auction. The US will release the Economic Data, too, such as Beige Book, Crude Oil Inventories, Housing Starts, and Building Permits, so, amid the reports, EUR/USD will move in a low to medium volatility during this day.
TODAY'S TECHNICAL LEVEL:
Breakout BUY Level: 1.1826.
Strong Resistance:1.1819.
Original Resistance: 1.1808.
Inner Sell Area: 1.1797.
Target Inner Area: 1.1769.
Inner Buy Area: 1.1741.
Original Support: 1.1730.
Strong Support: 1.1719.
Breakout SELL Level: 1.1712.
Analysis are provided byInstaForex.
-
19-10-2017, 07:59 AM #2413Senior Member

- Join Date
- Feb 2013
- Posts
- 212
- Feedback Score
- 0
- Thanks
- 0
- Thanked 0 Times in 0 Posts
Technical analysis of EUR/USD for Oct 19, 2017
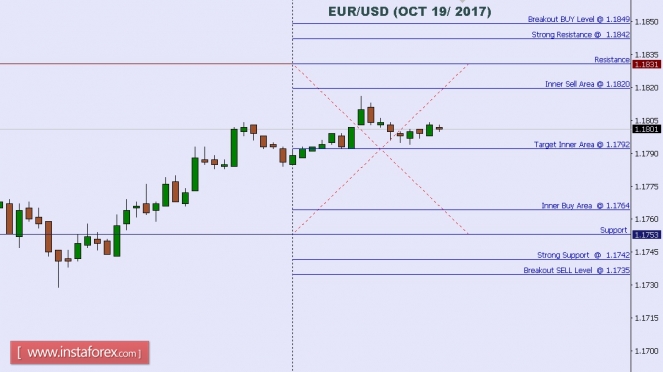
When the European market opens, some Economic Data will be released, such as Spanish 10-y Bond Auction. The US will release the Economic Data, too, such as Natural Gas Storage, CB Leading Index m/m, Philly Fed Manufacturing Index, and Unemployment Claims, so, amid the reports, EUR/USD will move in a ... volatility during this day.
TODAY'S TECHNICAL LEVEL:
Breakout BUY Level: 1.1849.
Strong Resistance:1.1842.
Original Resistance: 1.1831.
Inner Sell Area: 1.1820.
Target Inner Area: 1.1792.
Inner Buy Area: 1.1764.
Original Support: 1.1753.
Strong Support: 1.1742.
Breakout SELL Level: 1.1735.
Disclaimer: Trading Forex (foreign exchange) on margin carries a high level of risk, and may not be suitable for all investors. The high degree of leverage can work against you as well as for you. Before deciding to invest in foreign exchange you should carefully consider your investment objectives, level of experience, and risk appetite. The possibility exists that you could sustain a loss of some or all of your initial investment and therefore you should not invest money that you cannot afford to lose. You should be aware of all the risks associated with foreign exchange trading, and seek advice from an independent financial advisor if you have any doubts.
-
20-10-2017, 06:22 AM #2414Senior Investor
- Join Date
- Aug 2012
- Posts
- 1,942
- Feedback Score
- 0
- Thanks
- 0
- Thanked 0 Times in 0 Posts
Technical analysis of EUR/USD for Oct 20, 2017
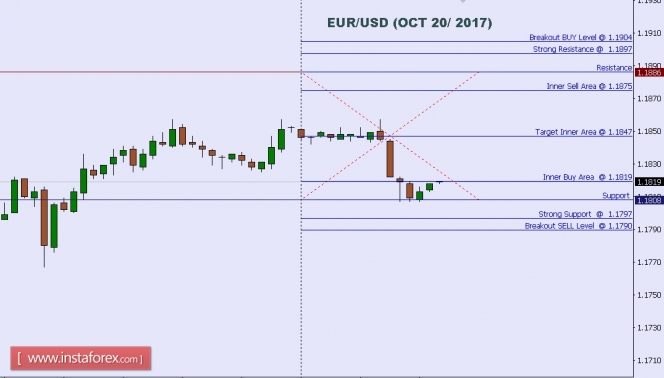
When the European market opens, some Economic Data will be released, such as Current Account and German PPI m/m. The US will release the Economic Data, too, such as Existing Home Sales, so, amid the reports, EUR/USD will move in a low to medium volatility during this day.
TODAY'S TECHNICAL LEVEL:
Breakout BUY Level: 1.1904.
Strong Resistance:1.1897.
Original Resistance: 1.1886.
Inner Sell Area: 1.1875.
Target Inner Area: 1.1847.
Inner Buy Area: 1.1818.
Original Support: 1.1808.
Strong Support: 1.1797.
Breakout SELL Level: 1.1790.
Analysis are provided byInstaForex.
-
23-10-2017, 08:31 AM #2415Senior Member
- Join Date
- Feb 2013
- Posts
- 212
- Feedback Score
- 0
- Thanks
- 0
- Thanked 0 Times in 0 Posts
Technical analysis of USD/JPY for Oct 23, 2017
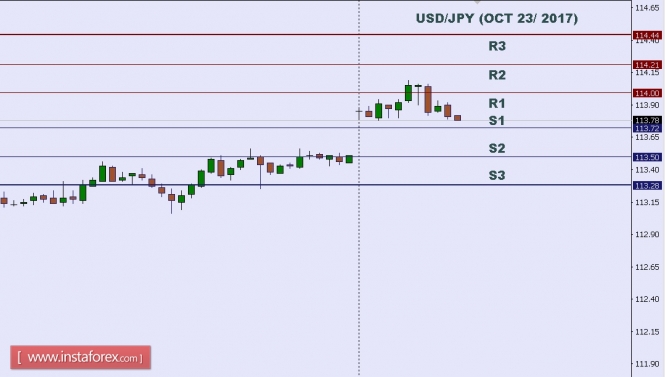
Today, Japan and the US will not release any Economic Data. So, there is a probability the USD/JPY will move with low volatility during this day.
TODAY'S TECHNICAL LEVEL:
Resistance. 3: 114.44.
Resistance. 2: 114.21.
Resistance. 1: 114.00.
Support. 1: 113.72.
Support. 2: 113.50.
Support. 3: 113.28.
Disclaimer: Trading Forex (foreign exchange) on margin carries a high level of risk, and may not be suitable for all investors. The high degree of leverage can work against you as well as for you. Before deciding to invest in foreign exchange you should carefully consider your investment objectives, level of experience, and risk appetite. The possibility exists that you could sustain a loss of some or all of your initial investment and therefore you should not invest money that you cannot afford to lose. You should be aware of all the risks associated with foreign exchange trading, and seek advice from an independent financial advisor if you have any doubts.
-
24-10-2017, 06:41 AM #2416Senior Investor
- Join Date
- Aug 2012
- Posts
- 1,942
- Feedback Score
- 0
- Thanks
- 0
- Thanked 0 Times in 0 Posts
AUD/JPY profit target reached perfectly, prepare to buy
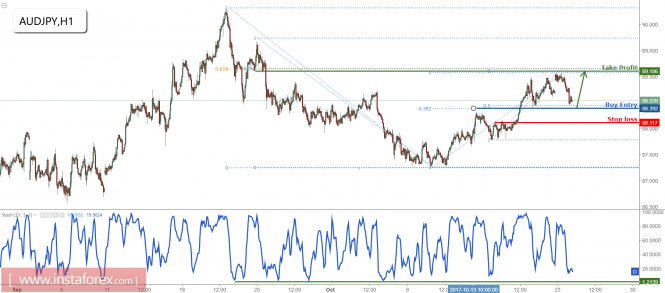
The price has dropped perfectly and reached our profit target. We now prepare to buy above major support at 88.39 (Multiple Fibonacci retracements, horizontal overlap support) for a push up to at least 89.10 resistance (Multiple Fibonacci retracements, recent swing high resistance).
Stochastic (21,3,1) is seeing support above 1.2% where we expect a corresponding bounce from.
Buy above 88.39. Stop loss is at 88.17. Take profit is at 89.10.
Analysis are provided byInstaForex.
-
25-10-2017, 06:43 AM #2417Senior Investor
- Join Date
- Aug 2012
- Posts
- 1,942
- Feedback Score
- 0
- Thanks
- 0
- Thanked 0 Times in 0 Posts
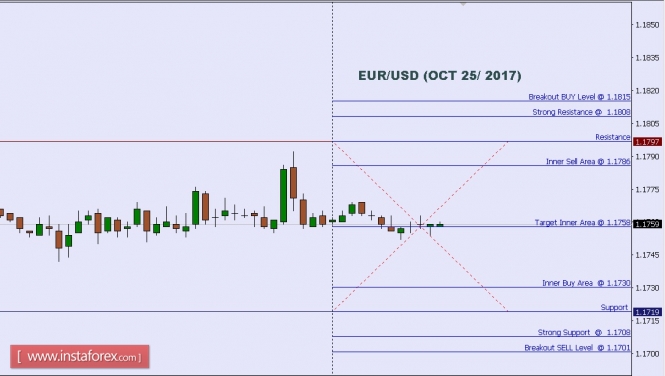
Technical analysis of EUR/USD for Oct 25, 2017
When the European market opens, some Economic Data will be released, such as German 10-y Bond Auction and German Ifo Business Climate. The US will release the Economic Data, too, such as Crude Oil Inventories, New Home Sales, HPI m/m, Durable Goods Orders m/m, and Core Durable Goods Orders m/m, so, amid the reports, EUR/USD will move in a low to medium volatility during this day.
TODAY'S TECHNICAL LEVEL:
Breakout BUY Level: 1.1815.
Strong Resistance:1.1808.
Original Resistance: 1.1797.
Inner Sell Area: 1.1786.
Target Inner Area: 1.1758.
Inner Buy Area: 1.1730.
Original Support: 1.1719.
Strong Support: 1.1708.
Breakout SELL Level: 1.1701.
Analysis are provided byInstaForex.
-
26-10-2017, 06:36 AM #2418Senior Investor
- Join Date
- Aug 2012
- Posts
- 1,942
- Feedback Score
- 0
- Thanks
- 0
- Thanked 0 Times in 0 Posts
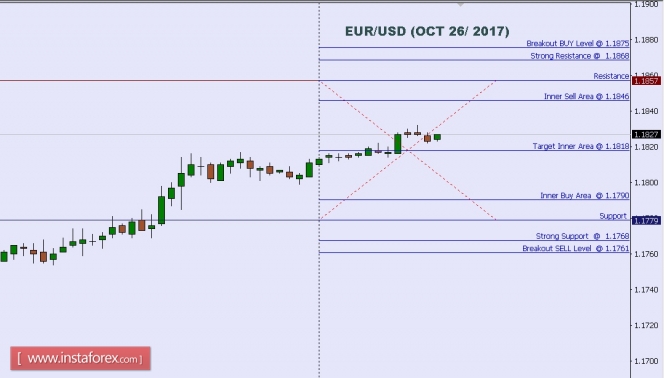
Technical analysis of EUR/USD for Oct 26, 2017
When the European market opens, some Economic Data will be released, such as Minimum Bid Rate, Italian 10-y Bond Auction, Private Loans y/y, M3 Money Supply y/y, Spanish Unemployment Rate, and German GfK Consumer Climate. The US will release the Economic Data, too, such as Natural Gas Storage, Pending Home Sales m/m, Prelim Wholesale Inventories m/m, Goods Trade Balance, and Unemployment Claims, so, amid the reports, EUR/USD will move in a medium volatility during this day.
TODAY'S TECHNICAL LEVEL:
Breakout BUY Level: 1.1875.
Strong Resistance:1.1868.
Original Resistance: 1.1857.
Inner Sell Area: 1.1846.
Target Inner Area: 1.1818.
Inner Buy Area: 1.1790.
Original Support: 1.1779.
Strong Support: 1.1768.
Breakout SELL Level: 1.1761.
Analysis are provided byInstaForex.
-
27-10-2017, 06:25 AM #2419Senior Investor
- Join Date
- Aug 2012
- Posts
- 1,942
- Feedback Score
- 0
- Thanks
- 0
- Thanked 0 Times in 0 Posts
Daily analysis of GBP/USD for October 27, 2017
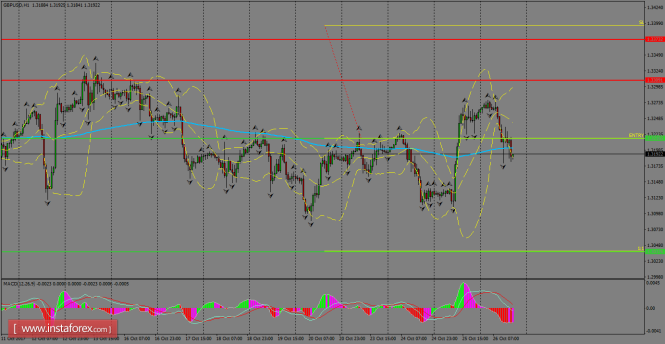
GBP/USD is piercing once again below the 200 SMA, confirming that it's trapped in between a narrow range. That's why we're no clear in which is the dominant trend across the board, but still, we're expecting a breakout lower. If the support level offered by October 20th lows give up, then we might see a decline towards the 1.3037 level.
H1 chart's resistance levels: 1.3309 / 1.3373
H1 chart's support levels: 1.3216 / 1.3037
Trading recommendations for today:
Based on the H1 chart, sell (short) orders only if the GBP/USD pair breaks a bearish candlestick; the support level is at 1.3216, take profit is at 1.3037 and stop loss is at 1.3398.
Analysis are provided byInstaForex.
-
30-10-2017, 05:30 AM #2420Senior Investor
- Join Date
- Aug 2012
- Posts
- 1,942
- Feedback Score
- 0
- Thanks
- 0
- Thanked 0 Times in 0 Posts
Daily analysis of GBP/USD for October 27, 2017
EUR / USD pair
Trend analysis (Figure 1)
The downward trend prevailed last week. The market tested again the resistance line and drove downwards. The price may fend off the support line and move higher in the following week. Complex analysis will accurately show the price direction.

Fig. 1 (weekly chart).
Indicator analysis on the weekly schedule (Figure 2).
The system of indicators ADX (Figure 2).
On the last run, the fast line (indicator 5 - white) and the slow line (indicator period 8 - blue) moved up.
In this case, the trend should be determined by trend type indicators.
MACD Indicator (period 5/8/13).
The linear part of the MACD indicator. Fast line (signal) - a line of white color.
The slow line (main line) is the blue line.
The result of the MACD indicator is a downward trend (100 points down). Histogram of the MACD indicator.
Histogram - columns of black color.
The result of the histogram of the MACD indicator is a downward trend (100 points down).
Overall: the MACD indicator on the weekly chart gives a downward trend.
Middle lines of the EMA.
On the weekly chart, the following midlines are used.
1 middle EMA line - color white (first shadow).
5 the middle line of the EMA - the color is red (the first shadow).
8 middle EMA line - the color is blue (trend of the week).
13 the middle line of the EMA - the color is yellow (the trend of the week).
21 middle EMA line - brown color (trend of the week).
At the last run 8, the middle EMA line (blue) is moving down over the 13th EMA midline (yellow), which also moved down - the signal is up. At the last run 13, the middle EMA line (yellow) is moving down above the 21 middle line of the EMA (black), which moved downward - the signal gain of the upper work.
The bottom line: the EMA mid-line system on the weekly chart gives an upward signal. The probability distribution of the indicators are as follows:
- average EMA lines - 24% up;
- MACD indicator (linear part) - 38% down;
- MACD indicator (histogram) - 38% down.
Overall: on technical analysis: the price on the weekly chart should have a downward trend.
Calculation of the first shadow of the week (Monday) on a weekly chart.
The middle lines of the EMA 1/5/8 are the lower signal.
The indicator "three lines" (the direction of the lines of indicators CCI (5), RSI (5), stochastics with a period of 3/3/4) is the lower signal.
Calculation of the RSI indicator system for the first tail is the bottom signal.
The bottom line: the calculation of the weekly candle from October 30 to November 04 showed that the price movement on Monday should move downward, but the final outcome depends entirely on the daily chart. Calculation of the second shadow of the week (Friday).
The calculation for the MACD linear part showed a downward trend (100 points down).
Calculation of the MACD histogram gave a downward trend (100 points down).
The bottom line: the calculation on Friday for the technical analysis showed that the price may have a downward trend, which should be confirmed by the daily chart.

Fig. 2 (weekly chart).
Complex analysis:
- indicator analysis - down;
- Fibonacci levels - down;
- volumes - down;
- candle analysis - neutral;
- trend analysis - up;
- Bollinger lines - up;
- monthly chart - down.
Conclusion on complex analysis - up.
The entire result of the calculation of candle currency pair EUR/USD on a weekly chart indicates the weekly price would likely to have an upward trend with the presence of the first lower shadow in the weekly white candle and the presence of a second upper shadow. The upper goal is 1.1670.
GBP / USD Pair
Trend analysis (Figure 1)
The downward trend prevailed last week. The price reached the support line at 1.3087 (white thick line). Most likely, there will be an upward trend next week. The level of probability for this scenario is likely shown in a comprehensive analysis.

Fig. 1 (weekly chart).
Indicator analysis on the weekly schedule (Figure 2).
The system of indicators ADX (Figure 2).
On the last run, the fast line (indicator 5 - white) moved upward, and the slow line (indicator period 8 - blue) moved down. In this case, the trend should be determined from the indicators of the oscillator type.
Stochastic indicator (period 3/3/4) on the weekly chart gives an upward trend (Fig. 2).
The system of indicators RSI (Figure 2).
When working with the daily chart, the following periods are used in the RSI indicator system: 21 (brown), 8 (blue), 13 (yellow), 5 (red).
On the last closed candle.
The calculation of the indicator RSI (5) on properties gives up.
Calculation of the indicator RSI (8) by properties gives up.
The bottom line: the RSI indicator system gives a downward trend.
The calculation of the indicator CCI on the properties moves down.
The bottom line: the CCI indicator system gives a downward trend.
Overall: according to the indicator analysis, the price on the weekly chart should have an upward trend.
Calculation of the first shadow of the week (Monday) on a weekly chart.
Middle lines EMA 1/5/8 - the upper signal.
The indicator "three lines" (the direction of the lines of indicators CCI (5), RSI (5), stochastics with a period of 3/3/4) is a neutral signal.
Calculation of the RSI indicator system for the first tail is the upper signal.
Result: the calculation of the weekly candle from October 30 to November 04, according to technical analysis showed that on Monday there will be an upper trend, but the price movement will determine the daily schedule.
Calculation of the second shadow of the week (Friday). The calculation for the MACD linear part - gave a downward trend (100 points down). Calculation of the MACD histogram - gave a downward trend (100 points down).
The bottom line: the calculation on Friday for the technical analysis showed that there will be a lower trend, but the price movement will determine the daily schedule.

Fig. 2 (weekly chart).
Complex analysis:
- Indicator analysis - up;
- Fibonacci levels - down;
- volumes - down; - candle analysis - neutral;
- trend analysis - up; - Bollinger lines - up;
- monthly graph - up.
Conclusion on the complex analysis is an upward movement.
The total result of the GBP / USD currency pair candlestick calculation according to the weekly chart shows the weekly price would likely to have an upward trend with the absence of the first lower shadow of the weekly white candle and the presence of the second upper shadow. The initial target is 1.3336.
* The presented market analysis is informative and does not constitute a guide to the transaction.
* The market analysis posted here is meant to increase your awareness, but not to give instructions to make a trade.
Analysis are provided byInstaForex.
-
Sponsored Links


 Reply With Quote
Thread Information
Users Browsing this Thread
There are currently 1 users browsing this thread. (0 members and 1 guests)
 Posting Permissions
24 Hour Gold

Advertising
- Over 20.000 UNIQUE Daily!
- Get Maximum Exposure For Your Site!
- Get QUALITY Converting Traffic!
- Advertise Here Today!
Out Of Billions Of Website's Online.
Members Are Online From.
- Get Maximum Exposure For Your Site!
- Get QUALITY Converting Traffic!
- Advertise Here Today!
Out Of Billions Of Website's Online.
Members Are Online From.


